 Back Next
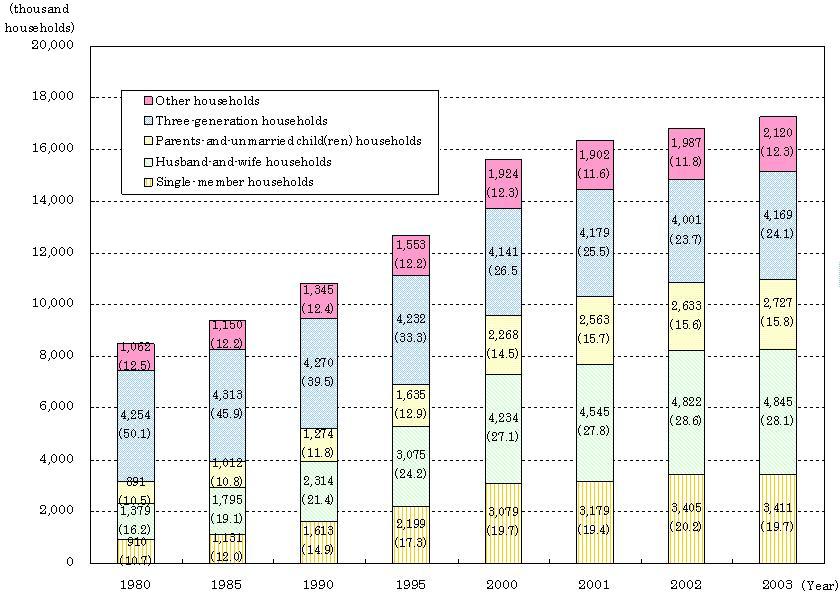
- The number of households with elderly aged 65 or older was 17.27 million in 2003, accounting for 37.7% of the total households (45.80 million). More specifically, 3.41 million are for single-member households (19.7%), 4.85 million are for husband-and-wife households (28.1%), 2.73 million are for parents-and-unmarried child(ren) households (15.8%), and 4.17 million are for three-generation households (24.1%). (Chart 1-2-1)
Chart 1-2-1. Trends in the Number of Households with Persons Aged 65 or Older and the Percentage Distribution Thereof by Family Composition
| Source: | Up to 1985: Ministry of Health and Welfare, "Basic Survey of Health and Welfare Administration" After 1986: Ministry of Health, Labour and Welfare, "Comprehensive Survey of Living Conditions of People on Health and Welfare" |
| Note: | 1. Hyogo Prefecture is excluded from figures in 1995. 2. Figures in parentheses refer to the rate to total number of households with persons aged 65 or older. |
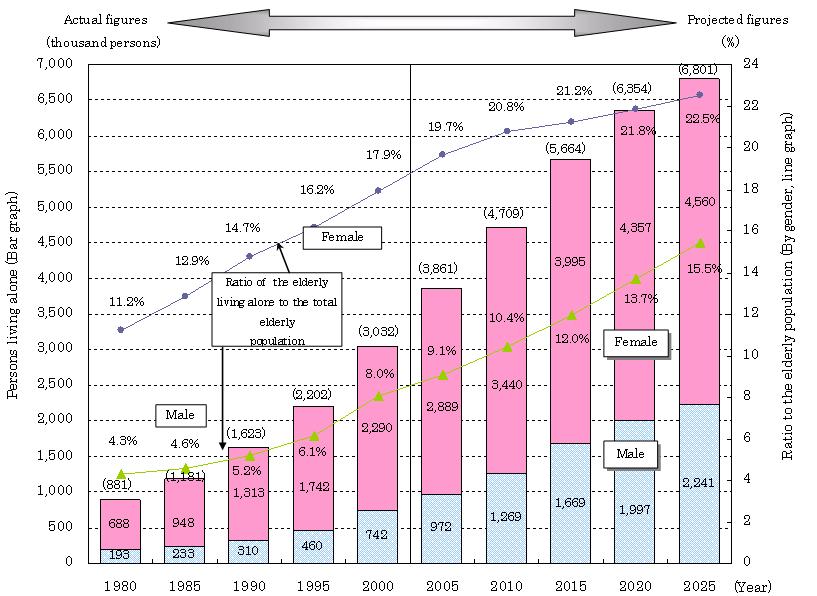
- The percentage of elderly living alone to the total elderly population aged 65 or older was 4.3% for males and 11.2% for females in 1980, while it strikingly increased in 2000, with males up to 8.0% and females up to 17.9%. It is estimated that the percentage of elderly living alone, above all males, will rise tremendously. (Chart 1-2-3)
Chart 1-2-3. Trends of the Elderly Living Alone
| Source: | Up to 2000: Ministry of Internal Affairs and Communications, "Population Census of Japan" After 2005: National Institute of Population and Social Security Research, "Household Projections for Japan," October 2003, "Population Projections for Japan," January 2002 |
| Note: | 1. "Persons living alone" refers to "single-member households" mentioned in the above Census and Projections. 2. Figures in parentheses just above the bar graph refer to the total number of the male and female elderly living alone. |
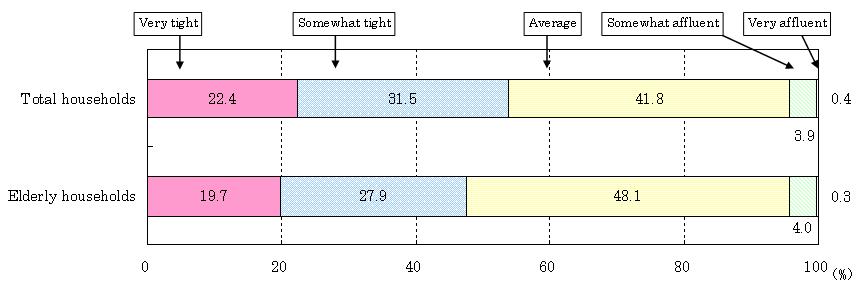
- Regarding the livelihood of the elderly, in elderly households (those composed of elderly 65+ only and elderly 65+ and their unmarried child(ren) under 18), the ratio of those who consider their present financial level to be "average" is higher than that of the total households, while the ratio for "tight" including both "very tight" and "somewhat tight" is low. (Chart 1-2-11)
Chart 1-2-11. Awareness about Living Conditions in Elderly Households
| Source: | Ministry of Health, Labour and Welfare, "Comprehensive Survey of Living Conditions of People on Health and Welfare," 2003 |
| Note: | "Elderly households" refers to the households comprising only person(s) aged 65+, and those comprising person(s) aged 65+ and unmarried person(s) under 18. |
- The average annual income of elderly households in 2002 was 3.046 million yen, about half of the average of the total households (5.893 million yen). Concerning the amount per family member, since the average number of family members is less in elderly households, it becomes 1.961 million yen, with no large gap between the average amount of the total households (2.047 million yen) and elderly households. (Table 1-2-13)
Table 1-2-13. Incomes of Elderly Households
| Average annual income | ||||
|---|---|---|---|---|
| Per household | Per household member (Average number of household members) |
|||
| Elderly households | Total income | 3,046 | 1,961 (1.55 persons) | |
| Earned income | 606 | (19.9%) | ||
| Public and retirement pensions | 2,041 | (67.0%) | ||
| Income from property | 225 | (7.4%) | ||
| Social security benefits other than pensions | 41 | (1.3%) | ||
| Remittance and others | 133 | (4.4%) | ||
| Total households | Total income | 5,893 | 2,047 (2.88 persons) | |
| Source: | Ministry of Health, Labour and Welfare, "Comprehensive Survey of Living Conditions of People on Health and Welfare," 2003 (Income for 2002 obtained from the Survey) | ||
| Note: | 1. "Elderly households" refers to the households comprising only person(s) aged 65+,and those comprising person(s) aged 65+ and unmarried person(s) under 18. 2. "Income from property" refers to the following.
|
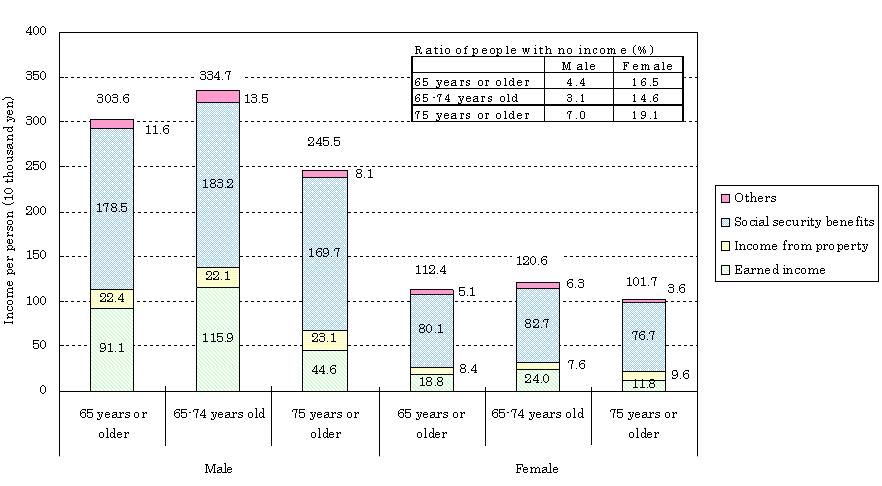
- The average personal income of males aged 65 or older is 3.036 million yen, while that of females is 1.124 million yen, which shows the average female income is just a little over one-third of the male income. The ratio of the female elderly 65 or older with no income (16.5%) is much higher than that of males (4.4%). (Chart 1-2-15)
Chart 1-2-15. Elderly Income Standard by Income Category, 2000
| Source: | Based on the re-totaled results of "Comprehensive Survey of Living Conditions of People on Health and Welfare" in "A Study on the Measures to Realize an Active and Productive Aging Society," 2002 and 2003 |
| Note: | The mean value including people with no income. "Earned income" refers to the total amount of employees' income, business income, farming & livestock income and household labor income, that is, incomes by working. "Income from property" refers to the total of house/land rent and interest or dividends. "Social security benefits" refers to the total of social security benefits including public and retirement pensions, and "others" refer to the total of incomes other than the above. |
- Observing saving behaviour of households with householders aged 65 or older, their average savings in 2003 amounted to 24.23 million yen, about 1.4 times higher than those of total households (16.90 million yen). The number of households with savings of 40 million yen or more accounts for 17.0% of total households with householders aged 65 or older. (Chart 1-2-20)
Chart 1-2-20. Percentage Distribution of Savings in Households with Householders Aged 65 or Older
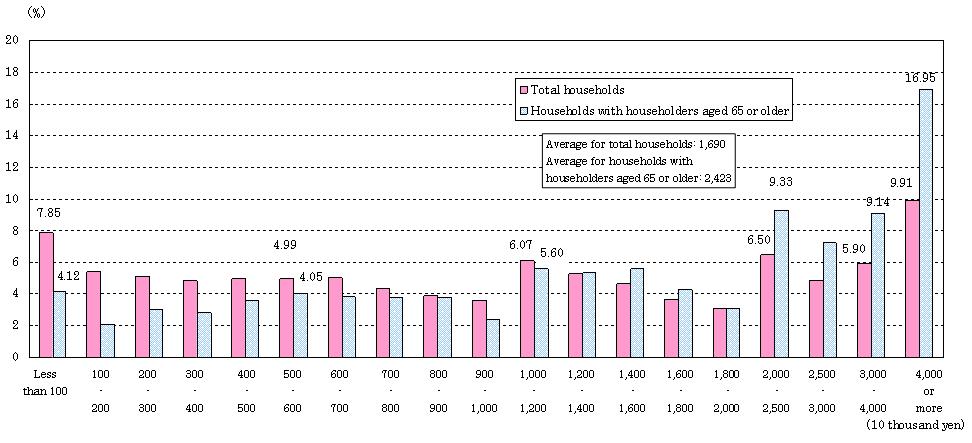
| Source: | Ministry of Internal Affairs and Communications, "Family Income and Expenditure Survey," 2003 |
| Note: | 1. Single-member households are excluded. 2. The above savings consist of deposits and savings at post offices, banks, and other financial institutions, bills for life insurance or reserve-type liability insurance, deposits to financial institutions such as shares, bonds, investment trust, and cash trust, intra-company deposits and deposits to non-financial institutions, including mutual aid associations related to one's work place. |
- The ratio of working males aged 55-59 is 89.9%, 66.5% among males aged 60-64, and 51.6% among males aged 65-69. Among workless males aged 60-64 (33.5%), more than 50% hope to work, and so do nearly 40% of those aged 65-69 (48.4%).
- The ratio of working females aged 60-64 is 41.5%, and 28.7% among females aged 65-69. Over 30% of workless females aged 60-64 (58.5%) and over 20% of those aged 65-69 (71.3%) wish to work. (Chart 1-2-25)
Chart 1-2-25. Working and Workless Status of the Elderly
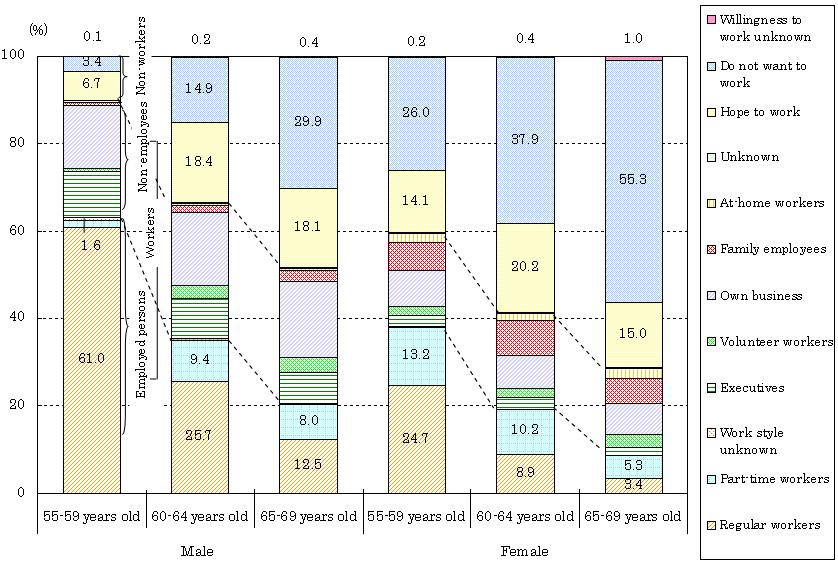
| Source: | Source: Based on Ministry of Health, Labour and Welfare, "Survey of Working Condition on Advanced Aged Workers," 2000 |
- Regarding health conditions of the elderly, the ratio of the elderly aged 65 or older (except for those hospitalized) with some subjective symptom due to illness or injury was 502.7 per 1,000 in 2001. The ratio of the elderly aged 65 or older with a negative impact on their daily life (those having trouble with transportation, outings, work, house chores, study, exercise, sports, etc. because of health problems, except for those hospitalized) is 235.0 per 1,000 in the elderly population. (Chart 1-2-28)
Chart 1-2-28. Ratios of Elderly 65+ with Complaints and with a Negative Impact on Their Daily Lives
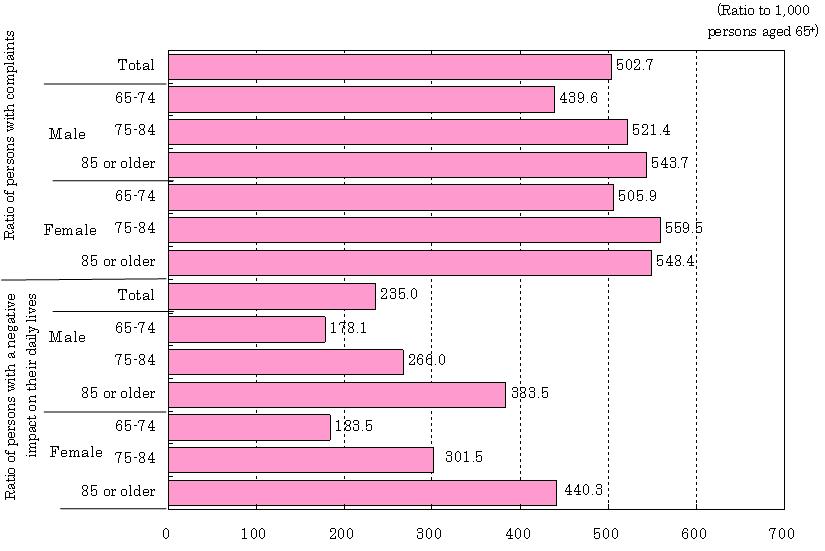
| Source: | Ministry of Health, Labour and Welfare, "Comprehensive Survey of Living Conditions of People on Health and Welfare," 2001 |
- The number of persons aged 65 or older certified as requiring long-term care or support in the Long-term Care Insurance System was 3.704 million at the end of FY2003. (Table 1-2-36)
Table 1-2-36. Status of the Elderly Requiring Care (Number of certified persons requiring long-term care or support)
| Total number of persons certified as requiring long-term care or support |
Support required |
Care level 1 | Care level 2 | Care level 3 | Care level 4 | Care level 5 | |
|---|---|---|---|---|---|---|---|
| Total insured persons | 3,838,924 (100.0) |
529,511 (15.4) |
1,240,366 (32.3) |
595,639 (15.5) |
485,575 (12.6) |
473,072 (12.3) |
451,761 (11.8) |
| Number of category 1 insured persons (65 years or older) | 3,704,095 (100.0) |
584,088 (15.8) |
1,198,091 (32.3) |
567,306 (15.3) |
465,669 (12.6) |
456,852 (12.3) |
432,089 (11.7) |
| 65-74 years old | 653,722 (100.0) |
113,948 (17.4) |
220,024 (33.7) |
103,820 (15.9) |
77,859 (11.9) |
69,338 (10.6) |
68,733 (10.5) |
| 75 years or older | 3,050,373 (100.0) |
470,140 (15.4) |
978,067 (32.1) |
463,486 (15.2) |
387,810 (12.7) |
387,514 (12.7) |
363,356 (11.9) |
| Source: | Ministry of Health, Labour and Welfare, "Annual Report on the Status of the Long-term Care Insurance Project," 2003 |
| Note: | 1. As of the end of March 2003. 2. Figures in parentheses are the ratio to the total number of certified persons requiring long-term care or support (Unit: %). |
According to the review in April 2004, the number of insured persons aged 65 or older who received Long-term Care Insurance services was 3.025 million. (Table 1-2-37)
Table 1-2-37. Status of Utilization of Long-term Care Insurance Services
(Number of persons who received Long-term Care Insurance services)
| Total | Support required | Care level 1 | Care level 2 | Care level 3 | Care level 4 | Care level 5 | |
|---|---|---|---|---|---|---|---|
| Total number of recipients (65 years or older) |
3,024.9 (100.0) |
382.8 (12.7) |
944.2 (31.2) |
489.7 (16.2) |
415.9 (13.7) |
414.7 (13.7) |
377.6 (12.5) |
| Male | 843.4 (100.0) |
84.7 (10.0) |
243.3 (28.9) |
158.9 (18.8) |
134.2 (15.9) |
123.8 (14.7) |
98.4 (11.7) |
| Female | 2,181.6 (100.0) |
298.1 (13.7) |
700.9 (32.1) |
330.8 (15.2) |
281.6 (12.9) |
290.9 (13.3) |
279.3 (12.8) |
| Source: | Ministry of Health, Labour and Welfare, "Monthly Report on the Actual Condition Survey Concerning Long-term Care Benefits," April 2004 |
| Note: | Figures in parentheses are the ratio to the total number of recipients (Unit: %) |
- Regarding the social participation of the elderly, 54.8% of the elderly are taking part in some sort of group activities. Specifically, 25.3% are participating in "Health/sports," 24.8% in "Hobby," and 19.6% in "Local events," and 9.1% in "Living environment improvement." (Chart 1-2-50)
Chart 1-2-50. Elderly Participation in Group Activities (multiple answers allowed)
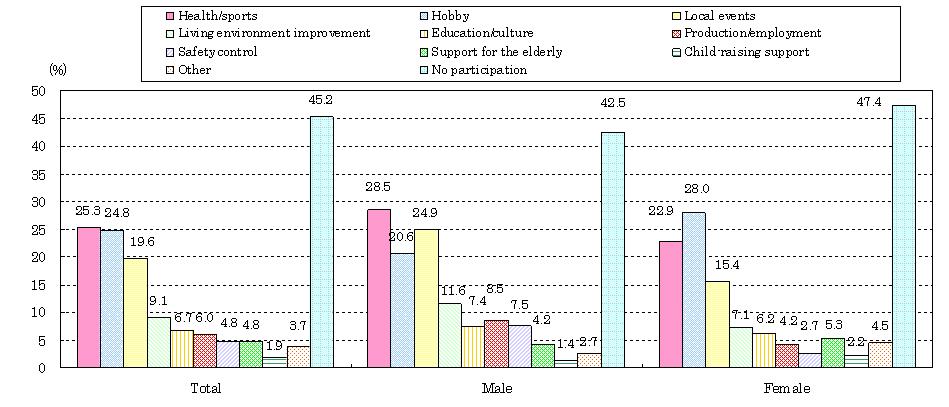
| Source: | Cabinet Office, "Attitude Survey on Participation in Local Communities by the Elderly,'' 2003 |
| Note: | Results from a survey for males and females aged 60 or older nationwide. |
- Regarding elderly home ownership, 84.0% of main households with the elderly aged 65 or older own their houses, 6.2% rent houses owned by local governments or public corporations, and 9.5% rent houses owned privately. The home ownership rate is higher for main households with the elderly aged 65 or older than for the total main households, while the home rental rate is lower for the former than for the latter. The home ownership rate is lower for single-elderly main households than for husband-and-wife elderly main households, while the home rental rate is higher for the former than for the latter. (Chart 1-2-56)
Chart 1-2-56. Elderly Home Ownership
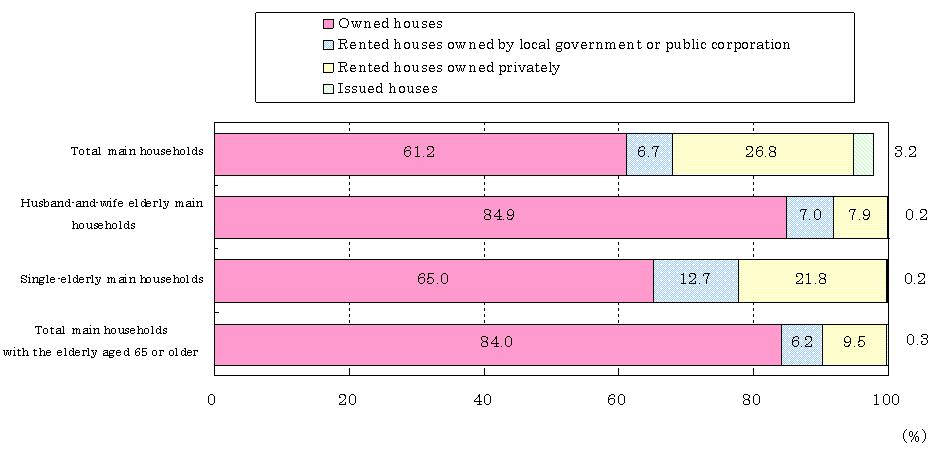
| Source: | Ministry of Internal Affairs and Communications, "Housing and Land Survey," 2003 |
| Note: | When a single household lives in a residence, the household shall be regarded as a "main household." When more than one household live in a residence, the household that includes the home owner or leasee shall be regarded as the main household. |
- Regarding how often the elderly go out, "Going out voluntarily" was the highest (60.2%), followed by "Going out if there is someone to go with or if my family or others ask me" (21.8%). By age group, "Going out voluntarily" is lower for the older elderly (75 or older) at 50.8% than for the younger elderly (65-74), while "Rarely going out" is higher for the former at 13.2% than for the latter. (Chart 1-2-62)
Chart 1-2-62. How frequently do the elderly go out?
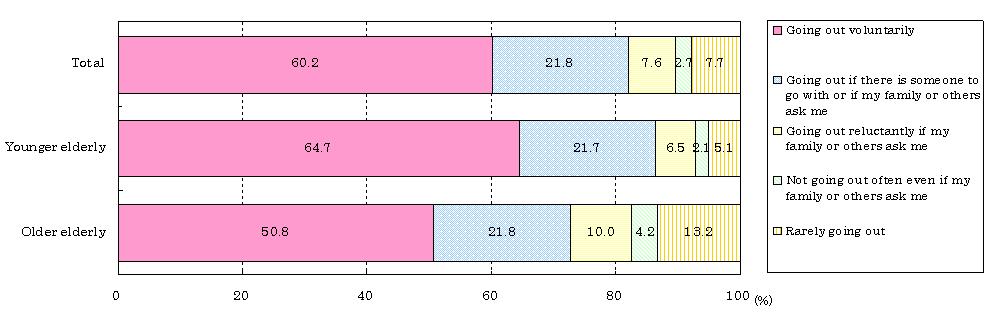
| Source: | Cabinet Office, based on "Attitude Survey on the Daily Life of the Elderly," 2004 |
| Note: | Results for only those aged 65 or older. |
- In 2004, the number of elderly aged 65 or older killed in traffic accidents reached 3,046, accounting for 41.4% of the total deaths by traffic accidents. Although the youth aged 16 - 24 had made up the majority of deaths due to traffic accidents until 1992, the elderly exceeded the youth in number of deaths in 1993. Since then, the percentage of the elderly to total traffic fatalities has continued to increase, while that of the youth has continued to decrease. (Chart 1-2-66)
Chart 1-2-66. Trends in Traffic Accident Deaths by Age Group
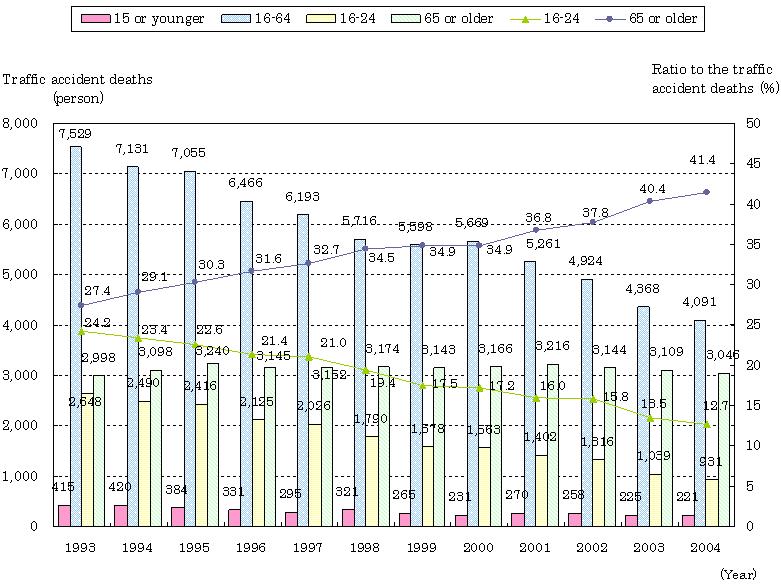
| Source: | National Police Agency, "Traffic Statistics" |
- Regarding the elderly involved in crime or disaster, the number of penal code offenses known to the police that involved elderly victims aged 65 or older was 223,720 in 2003, accounting for 9.3% of the total offenses known. In 2004, the number of "ore ore sagi" ("it's me, it's me" fraud) cases, a kind of telephone fraud, known to the police was 14,459, 26.5% of which were accounted for by elderly victims aged 65 or older.
Top Page > Annual Report on the Aging Society > Annual Report:2005
