Volume 1. Land Transport
Part 1. Road Transport
Chapter 1.
Trends in Road Traffic Accidents
Long-term trends in road traffic accidents
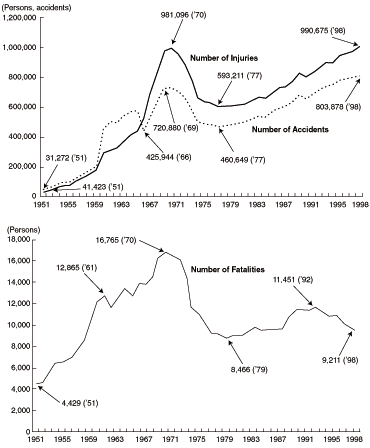
In the post-war period, from the early 1950s through to the early 1970s, the
annual number of fatalities resulting from road traffic accidents rose steadily.
This was due to several factors, including a lack of traffic safety infrastructure
and the rapid growth in private motor vehicle ownership. Between 1951 and 1969,
annual road fatalities rose from 4,429 to 16,257, while annual injuries soared
from 31,274 to 967,000.
In view of the seriousness of this situation, improving traffic safety became
an urgent issue, and around this time, a range of traffic safety measures was
pushed at the national level. Two examples are the Traffic Safety Policies Law,
which was enacted in 1970, and the formulation of the First Fundamental Traffic
Safety Program (FY1971-FY1975).
The latter program put priority on measures for pedestrians, setting a target
to reduce the annual pedestrian fatalities by 1975 to half the projected number
for that year, which was 8,000. Total pedestrian fatalities fell to 3,732 in
1975, comfortably achieving the program target. The Second Fundamental Traffic
Safety Program (FY1976-FY1980) set the ambitious target of cutting annual traffic
accident fatalities to half the 1970 figure of 16,765-the worst on record-by
1980. In 1979, the number had fallen to 8,466, increasing only slightly to 8,760
in 1980, thereby coming very close to achieving the target of the second program.
The program also succeeded in cutting total injuries from 981,096 in 1970 to
596,282 in 1979.
After this, annual road traffic fatalities began rising again, exceeding 9,000
in 1982 and then 10,000 in 1988, putting the targets of the third (FY1981-FY1985),
fourth (FY1986-FY1990) and fifth (FY1991-FY1995) Fundamental Traffic Safety Programs
out of reach.
Taking into account this trend, the Sixth Fundamental Traffic Safety Program
(FY1996-FY2000) aims to bring down annual traffic fatalities to under 10,000
by 1997 and to under 9,000 by 2000. The program sets out to do this by aggressively
promoting appropriate and effective traffic safety measures that fully address
traffic accident realities.
The latest statistics show that annual traffic accident fatalities fell below
10,000 in 1996 and further down to 9,211 in 1998 (Fig. 1), despite the unfortunate
fact that traffic accident injury rates continue rising as the total numbers
of vehicle owners, driving license holders and vehicle-kilometers traveled increases.
In fact, total traffic accident injuries (990,675) for 1998 was the worst figure
on record.
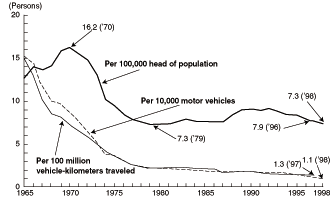
A look at traffic accident fatalities per 100,000 population shows a steady
rise to 16.2 in 1970, followed by a decline to 7.3 in 1979. Since then we have
seen repeated increases and decreases, with the rate standing at 7.3 in 1998.
Fatality rates per 10,000 motor vehicles and per 100 million vehicle-kilometers
traveled fell steadily until the late 1970s and have continued on a slight downward
trend since (Fig. 2).
| Figure 1 |
Changes in Traffic Accidents and Casualties |
| Notes: 1. |
Source: National Police Agency |
| 2. |
Figures after 1966 do not
include property-damage-only accidents. |
| 3. |
Figures for Okinawa Prefecture
were not included before 1971. |
|
|
| Figure 2 |
Changes in Traffic Accident Fatalities per 100,000 Population,
per 10,000 Motor Vehicles and per 100 Million Vehicle-Kilometers Traveled |
| Notes:
1. |
Source: National Police Agency |
| 2. |
Population figures are based
on the Management and Coordination Agency's data, as of Oct. 1 each year. |
| 3. |
Motor vehicle figures are
based on the Ministry of Transport's data, as of Dec. 31 each year. |
| 4. |
Vehicle-kilometers traveled
are based on the Ministry of Transport's data. Data for light vehicles
are included beginning FY1987. |
|
|
Road traffic accidents
in 1998
1. Overview
In 1998 there were 803,878 traffic accidents (defined herein as accidents involving
casualties) resulting in 9,211 fatalities and 990,675 injuries. Although the
death toll was 429 (4.5%) down from the previous year, total traffic accidents
and total injuries were both up over the previous year-by 23,479 (3.0%) and 31,750
(3.3%) respectively. So despite the fact that total traffic accident fatalities
were under 10,000 for the third straight year, the situation remains serious.
For the sixth year in succession there was a record number of accidents and 1998
marked the worst year for total injuries.
2. Prominent characteristics of traffic fatalities
Compared to the previous year, traffic accident fatalities for 1998 declined
for all types of road users except motorcycle riders, the most marked declines
being for young (16-24) motor vehicle occupants.
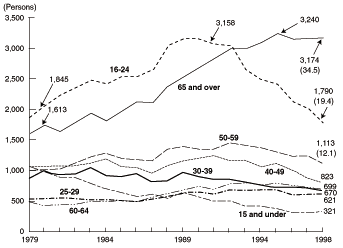
(1) Traffic accident fatalities and injuries by age group
1) A significant proportion of those killed in traffic accidents were young people
aged 16 to 24 (1,790) and the elderly ages 65 and over (3,174). Together, these
two age groups accounted for
| Figure 3 |
Changes in Traffic Accident Fatalities by Age Group |
| Notes: 1. |
Source: National Police Agency |
| 2. |
Figures in parentheses show
percentage (%) of fatalities by age group. |
|
|
| Figure 4 |
Changes in Traffic Accident Injuries by Age Group |
| Notes: 1. |
Source: National Police Agency |
| 2. |
Figures in parentheses show
percentage (%) of injuries by age group. |
|
|
53.9% of all traffic fatalities.
Compared to the previous year, traffic accident fatalities declined for all age
groups except children 15 and under (up 26), 30-39 year olds (up 25) and those
65 and over (up 22). The most dramatic declines were seen for 16-24 year olds
(down 236), 60-64 year olds (down 133) and 50-59 year olds (down 61). (See Fig.
3)
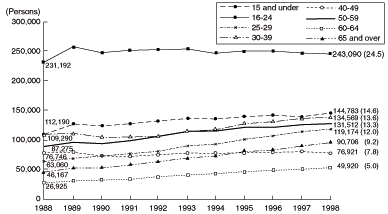
2) Young people ages 16 to 24 were injured in traffic accidents in disproportionately
high numbers (243,090), accounting for 24.5% of all traffic injuries. Compared
to the previous year, traffic accident injuries increased sharply for 30-39 year
olds (up 11,379), 50-59 year olds (up 9,115), 25-29 year olds (up 7,496) and
those 65 and over (up 4,574). (See Fig. 4)
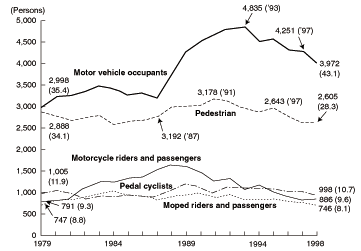
(2) Traffic accident fatalities and injuries by road user type
1) The road user type that suffered the greatest number of traffic fatalities
was motor vehicle occupants (drivers and passengers), accounting for 43.1% of
the total. Compared to the previous year, fatalities declined for all road user
types except for motorcycle riders (up 27), with an especially large drop for
motor vehicle occupants (down 279). (See Fig. 5)
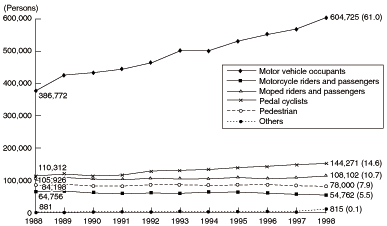
2) The road user type that suffered the greatest number of traffic injuries was
also motor vehicle occupants, accounting for 61.0% of the total. Compared to
the previous year, injuries were higher for all road user types except motorcycle
riders (down 1,900) and pedestrians (down 1,108), with especially large increases
for motor vehicle occupants (up 31,754). (See Fig. 6)
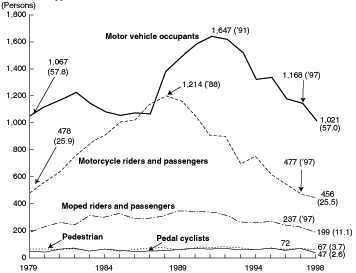
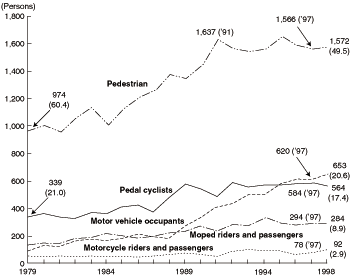
(3) Traffic accident fatalities involving young people or senior citizens by
road user type
1) Young people (16-24 years old)
Fatalities among motor vehicle occupants have been falling since 1992 (a one-time
increase
| Figure 5 |
Changes in Traffic Accident Fatalities by Road User Type |
| Notes: 1. |
Source: National Police Agency |
| 2. |
Figures in parentheses show
percentage (%) of fatalities by road user type. |
|
|
| Figure 6 |
Changes in Traffic Accident Injuries by Road User Type |
| Notes: 1. |
Source: National Police Agency |
| 2. |
Figures in parentheses show
percentage (%) of injuries by road user type. |
|
|
| Figure 7 |
Changes in Fatalities Involving Young People by Road User Type |
| Notes: 1. |
Source: National Police Agency |
| 2. |
Figures in parentheses show
percentage (%) of fatalities involving young people by road user type. |
|
|
| Figure 8 |
Changes in Fatalities Involving Senior Citizens by Road User Type |
| Notes: 1. |
Source: National Police Agency |
| 2. |
Figures in parentheses show
percentage (%) of fatalities involving senior citizens by road user type. |
|
|
| Figure 9 |
Changes in the Fatality Rates among Motor Vehicle Occupants Involved
in Traffic Accidents by Seat Belt Use; and Changes in the Proportion
of Motor Vehicle Occupants Using Seat Belts When Killed or Injured in
Accidents |
| Notes: |
Source: National Police Agency |
|
|
in 1995 was followed by drops
in the following three years), while fatalities among motorcycle riders have
been on the decline since 1989 (a one-time increase in 1994 was followed by drops
in the following four years.) (See Fig. 7)
2) The elderly (65 years old and over)
As the number of elderly citizens driving has increased, so too have fatalities
for motor vehicle occupants in this age group. A breakdown of traffic accident
statistics for the elderly in 1998 shows that motor vehicle occupants were second
only to pedestrians in number of fatalities. For the fourth straight year, more
elderly persons died as vehicle occupants than as pedal cyclists. Pedestrian
fatalities peaked in 1995, fell in 1996 and 1997, and then increased slightly
in 1998. (See Fig. 8)
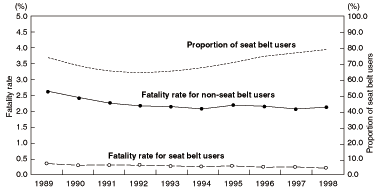
(4) Fatalities and injuries among motor vehicle occupants by seat belt use
The proportion of the motor vehicle occupants killed or injured in road traffic
accidents with their seat belts fastened has grown since 1993. The fatality rate
of seat belt users (ratio of their fatalities to total traffic accident fatalities)
is around eight times less than that of people not wearing belts. The increase
in the proportion of people wearing seat belts has contributed to the decline
in traffic accident fatalities among motor vehicle occupants. (See Fig. 9)
Chapter 2.
Main Factors Behind the Recent Decline in Road Traffic Accident Fatalities
(1) Outline of the analysis
There has been a steady decline in traffic accident fatalities since 1993
(except 1995 when the toll rose). Clearly identifying the main factors behind
this decline is extremely important because it allows us to take more comprehensive
countermeasures by advancing those measures that have been most effective in
reducing accident fatalities and examining the status of other measures.
The circumstances of traffic accidents and the harm and damage they cause
can vary in an infinite variety of ways, with complex interactions between different
factors. For this reason, it is difficult to determine and clearly explain the
factors responsible for the drop in traffic accidents over recent years. While
recognizing this, however, we have attempted to isolate and analyze these factors
as accurately as possible, according to the following basic guidelines.
1) We analyzed available data on traffic accidents over many years.
2) When looking at changes over a long period of time, the influence of demographic
changes cannot be ignored, so we paid close attention to statistics such as the
numbers of fatalities and fatal accidents for different age groups, and analyzed
the shifts in traffic accident factors for these different age groups.
3) To explore changes in the number of fatal traffic accidents in which primary
parties were motor vehicle drivers, or motorcycle or pedal cycle riders, we tried
to distinguish the features of such accidents from as many viewpoints as possible,
looking at age, vehicle type, types of road laws violated, and purpose of travel.
We then tied to understand how these factors combined in contributing to accidents.
4) There has been some suggestion that the economic recession of recent years
may have played a part in the decline in the number of traffic accident fatalities.
We tried to verify this hypothesis by comparing indexes of economic changes with
traffic accident numbers and other factors.
(2) Analysis of the circumstances of traffic accidents
1) A review of the number of traffic accident fatalities (or the number of fatal
accidents) for each age group (or each age group of license holders), shows a
clear decline in recent years for all age groups.
When we classify traffic accidents according to the type of person killed
or injured (motor vehicle occupant, motorcycle rider, under-50 cc moped rider,
pedal cyclist, or pedestrian), type of accident, type of laws violated and purpose
of travel, we come up with a total of 39 main categories of accident conditions.
Out of these cases, 33 fit the descriptions given under a) or b) below.
a) Although the number of traffic accident casualties (or number of accidents
resulting in injury or death) has been increasing (or holding steady), the number
of fatalities (and number of fatal accidents) has been falling in recent years
(18 cases).
b) Both the number of traffic accident casualties (and number of accidents resulting
in injury or death) and the number of fatalities (and number of fatal accidents)
have been falling in recent years (15 cases).
In many (13 out of 15) of the cases falling under category b), the number
of fatalities (and number of fatal accidents) has fallen faster than the number
of accident casualties (and number of accidents resulting in injury or death).
Many of these accidents were of type that could have caused greater damage (10
out of 13).
This recent decline in the number of fatalities (and number of fatal accidents)
began within the last 10 years though there is some variation.
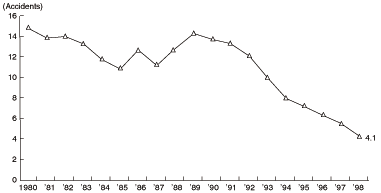
(3) Trends in accidents involving young people
Accidents in which young people became primary parties while riding motor
vehicles, motorcycles or pedal cycles were examined. It showed that both the
number of accidents involving death or serious injuries and the number of fatal
accidents have been falling rapidly in recent years.
One reason for this is simply the fall in the population of young people holding
licenses. Another reason is large drops in the number of motorcycle accidents,
the number of accidents involving motor vehicles on joy rides (driving for pleasure
as opposed to transport) and the number of accidents involving a violation of
speed limits. (See Fig. 10)
| Figure 10 |
Changes in Accidents Resulting in Death or Serious Injury Caused
by Young Motor Vehicle Drivers Violating Speed Lim-its, per 100,000 License
Holders (Ordinary Vehicle Licenses) |
| Notes:. |
Based on materials prepared
by the National Police Agency and the Institute for Traffic Acci-dent
Research and Data Analysis. |
|
|
| Figure 11 |
Changes in Accidents Resulting in Death or Injury per Vehicle-kilometer
for Trucks |
| Notes: |
Based on materials prepared
by the National Police Agency and the Institute for Traffic Accident
Research and Data Analysis. |
|
|
It is also clear that the
numbers of other types of accidents (apart from those mentioned above) caused
by young people have been falling in recent years at about the same rate as for
other age groups. This is reflected in a fall in the number of fatal accidents
per license holding population and a fall in the ratio of fatal accidents to
total accidents resulting in injury or death (fatal accident ratio).
Furthermore, there is evidence that the drops in the number of accidents involving
motor vehicles on joy rides and the number of accidents involving violations
of speed limits are related to changes in the economic circumstances of young
people. (A strong inverse correlation was found between the unemployment rate
for 15 to 24 year olds and the number of accidents that resulted in death or
serious injury and involved violations of speed limits, on a per license holding
population basis for the same age group.)
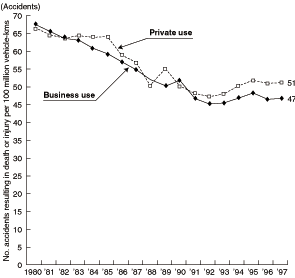
(4) Influence of economic conditions
There is no conclusive evidence to support the contention that the numbers
of accidents involving private passenger cars or trucks (both private use and
business use) have been influenced by economic conditions.
1) The steady increase in the number of accidents involving private passenger
cars in daily use (e.g. shopping or social purposes) suggests that private transport
is becoming an almost indispensable feature of the lives of people and that consequently
economic conditions have not had much effect on this trend.
2) Figures for trucks, for private use and business use, show that both on a
per-vehicle-kilometers-traveled basis and a per-number-of-vehicles-owned basis,
the number of accidents resulting in injury and death, as well as the number
of fatal accidents, steadily declined in the years after 1980. However, since
bottoming out in 1992, these statistics have either risen very slowly or remained
steady. If they continue to remain steady at a fixed level, we can expect that
the number of accidents involving trucks will be influenced significantly by
economic conditions. (See Fig. 11)
(5) Effects of traffic safety measures
A study of the circumstances of traffic accidents from various angles has found
that the decline in the number of traffic accident fatalities and the number
of fatal accidents is occurring in most circumstances. Even if social factors
such as lifestyle changes have played a part in this general drop in road fatality
rates, they cannot fully explain it.
In view of the fact that the total number of accidents has been increasing,
we have to realize that measures implemented to prevent traffic accidents in
the first place are not working as effectively as they should. We can conclude,
however, that the combination of initiatives designed to prevent the most lethal
and destructive kinds of accidents (Major Accident Prevention Measures) and to
minimize the risk of death and destruction after accidents have occurred (Damage
Minimizing Measures) has been effective, contributing significantly to reducing
the number of traffic accident fatalities in recent years.
Of the specific measures outlined below, some have been continued, improved
or intensified in terms of quality and quantity over the past years, while others
have been newly implemented. They have gradually, with some time lags between
them, begun to prove their effectiveness over the last 10 years for all age groups.*
It is believed that the combination of these measures has contributed to the
nationwide drop in traffic accident fatalities since 1993.
*The number of the elderly killed in traffic accidents has been steadily increasing
in recent years, except for a one-off drop in 1996. However, the fatalities per
100,000 population have fallen at around the same rate as for other age groups.
Thus, we can conclude that the number of elderly fatalities have risen only as
a result of the population increase in this age group.
1) Increase in seat belt use
The Seat Belt Use Promotion Council was set up in 1992 in coordination with
related ministries and agencies and private organizations. The council put into
effect a vigorous campaign of activities aimed at expanding awareness about seat
belts, using the Selective Traffic Enforcement Program (STEP) method (combining
education, public relations and enforcement programs). Through these efforts,
the seat belt usage rate (measured as the proportion of motor vehicle occupants
involved in traffic accidents resulting in death or injury who were wearing seat
belts) has climbed steadily, from 64.0% in 1992, to 79.7% in 1998.
2) Improving traffic safety infrastructure, reducing accident メblack spots,モ
etc.
a) Traffic safety infrastructure, such as sidewalks and traffic signals, have
been expanded and improved according to a long-term plan drawn up according to
the Emergency Measures Act on Traffic Safety Infrastructure Improvement (1966,
Legislation 45). Between 1980 and 1998, the amount of installed traffic infrastructure
has increased significantly: 1.7 times for sidewalks, 2.2 times for road lights,
1.7 times for traffic signals, and 1.8 times for pedestrian crossings.
b) Accidents on arterial roads tend to occur most frequently at specific sections
of road. In view of this, the causes of accidents occurring at these so-called
メblack spotsモ and surrounding areas are analyzed, and the findings are used to
develop measures to reduce the risk and degree of danger of accidents at these
points.
Statistical and scientific analysis of data from the Integrated Traffic Accident
Database (including both road traffic and accident data) managed by the Institute
for Traffic Accident Research and Data Analysis (ITARDA), identified 3,196 accident
black spots on arterial roads (1,713 crossings and 1,483 sections) according
to a common national standard. Since 1996, a group known as the Accident Black
Spots Measures Promotion Council, consisting of prefectural public safety commissions,
as well as road administration authorities, has been investigating the causes
of traffic accidents at all these black spots. The results of these investigations
have been used to take concrete action to reduce the risk and danger of specific
black spots, through measures such as improving intersections, installing road
lights and signals, and reviewing traffic regulations.
c) The aim of the Community Zone Creation Project is to promote greater safety
for local people by reducing the volume of traffic passing through residential
and commercial districts in urban areas. Based on plans developed in cooperation
with the local people involved, the project combines measures such as traffic
control (e.g. traffic zoning) instituted by prefectural public safety commissions,
and roadway improvements by road administration authorities on community roads
and other roads shared by pedestrians and cars.
d) With the active participation of local people and road users, prefectural
public safety commissions are working together with road administration authorities
to conduct comprehensive traffic safety inspections to assess traffic conditions
in local areas. Based on the results of these inspections, steps are taken to
improve the road traffic environment.
3) Vehicle safety improvements
a) One of the most effective strategies in the area of improving vehicle safety
has been the toughening of safety standards for cars. Several of the major revisions
to vehicle safety regulations made since 1980 are considered to have played a
key role in reducing fatal accidents involving collisions and single-vehicle
accidents. These revisions have brought about stricter controls to prevent fuel
leakage after collisions; improved seat belt performance and an increase in the
number of vehicles fitted with seat belts; use of double glazed windscreens;
introduction of large-size protection devices to be installed on the rear end
of trucks to keep another vehicle from ramming into the rear; and introduction
of head-on collision standards for passenger cars. Some other developments that
are believed to be keeping accident rates down include the inclusion of ABS (anti-lock
braking systems) on some models of large vehicles, the use of large view reflectors
on the back of large trucks, and the introduction of high speed brake performance
standards for passenger cars.
b) Automobile Safety Information, like the results of comparative evaluations
of safety features such as the impact resistance of passenger cars, and instructions
on using safety devices properly have been made available to motor vehicle users
since 1995. This has stimulated the development of safety technology and encouraged
commercialization of safer-to-drive motor vehicles.
4) Measures aimed at new drivers
According to an amendment to the Road Traffic Law in 1989, when drivers commit
certain specified types of traffic offenses within one year of obtaining their
license, they are given the opportunities to attend re-education classes for
new drivers. Those who choose not to attend these classes must sit for their
license tests again before being allowed to drive. (Working in small groups,
participants in these driver re-education classes practice driving on the streets
and undertake simulator training on recognizing and avoiding danger, as well
as doing other exercises.)
5) Stricter controls on dangerous road behavior
Police officers on motorcycles, in patrol cars, and other uniformed police
officers have been deployed increasingly on the streets in order to enforce traffic
order for the purpose of reducing the number of accidents. Particularly, at intersections
and sections of arterial roads where traffic accidents occur frequently, roving
patrols and stationary monitoring were held to watch for traffic offenses with
a special emphasis on dangerous offenses that may potentially result in fatalities
and serious injuries such as drunken driving, unlicensed driving, speeding violations,
failing to obey red lights and stop signs, recklessly endangering pedestrians,
etc. Some such drivers were penalized and others were given guidance or warning.
6) Advances in rescue and first aid medical services
a) As of the end of FY1998, there were 142 registered Rescue and First Aid Centers
throughout Japan. Each center is ready 24 hours a day to provide highly professional
medical care to serious road accident casualties requiring attention of more
than one medical sphere. Since the end of FY1988, 41 more centers were established
to make major improvements in the availability and quality of first aid services.
b) The Emergency Life-Saving Technicians Law, which was enacted and put into
effect in 1991, is a system that offers paramedical qualifications that allow
one to participate in first aid under the instruction of doctors and as their
assistant. Since the first national examinations for the qualification were held
in April 1992, approximately 2,000 people each year have qualified as "emergency
life-saving technicians." As of the end of FY1998, there were a total of 15,301
emergency life-saving technicians in Japan. Also, as of July 1, 1998, 6,920 first
aid professionals working in fire fighting organizations had earned the emergency
life-saving technicians qualification.
Chapter 3.
Achieving the Targets of the Sixth Fundamental Traffic Safety Program
As indicated in (1) to (5) below, there are still many challenges ahead to
ensure that the number of traffic accident fatalities continues to fall over
the coming years. In tackling these challenges we need to focus special attention
and effort on halting the recent growth in the number of accidents resulting
in injury or death. At the same time, we need to make sure that the steady decline
seen in the death toll continues, by pressing ahead with measures to prevent
fatal accidents. In so doing, we need to achieve the target of the Sixth Fundamental
Traffic Safety Program that would cut total annual deaths to less than 9,000
by the year 2000.
(1) It is anticipated that in the years ahead, the number of elderly licensed
drivers will rise faster than the number of the aged in the population. For this
reason, at least in the short term, the number of accidents primarily caused
by elderly males (driving a motor vehicle), which has risen sharply in the last
few years, is likely to continue growing. Also, although women now account for
only around 10% of accidents caused by elderly drivers, it is quite possible
that the number of accidents caused by elderly females will rise substantially.
In addition, compared to accidents caused by drivers of other age groups, accidents
caused by the elderly are more likely to be fatal (higher ratio of fatal accidents
to total accidents resulting in injury or death). It can therefore be expected
that the number of fatal accidents caused by the aged will also trend upward.
(2) The number of accidents involving violations of road safety regulations has
been rising in recent years for all the following cases: accidents resulting
in injury and death, accidents resulting in fatalities or serious injuries, and
fatal accidents. The breakdown of figures on a per-license-holder-population
basis shows that the numbers of such accidents vary little between different
age groups. Also relevant is the fact that the total number of license holders
is still increasing. In view of these factors, we can expect the number of serious
accidents resulting from violations of traffic safety regulations to increase
in the near future, thereby contributing to increasing the total number of fatal
accidents. The use of mobile phones and car navigation systems, which have rapidly
become widespread in recent years, is yet another factor that has the potential
to lift accident rates due to the risk of drivers losing concentration on road
conditions ahead.
(3) Accidents involving speeding violations and head-on collisions are much more
likely than other types of accidents to result in fatalities and serious injuries.
Improvement of the safety performance of vehicles alone will not substantially
reduce the risk of death or serious injury when accidents occur. To prevent such
accidents, more effort needs to be focused on improving road conditions and introducing
better road safety education. A more subtle challenge relates to the continually
improving level of vehicle safety performance. Some measures may be needed to
explain the limits to the protection offered by vehicle safety features, to discourage
people from driving recklessly under a false sense of security based on the advanced
safety features of their vehicles.
(4) It is necessary to realize that a future improvement in general economic
conditions may well lead to a rise in the number of fatal accidents.
(5) Figures for the number of accident fatalities reveal that the rate of decline
in accident fatalities varies considerably between prefectures. These regional
differences stem from differences in a variety of factors, such as demographics,
the state of road and traffic-related infrastructure, social and lifestyle factors,
road behavior, traffic safety efforts, as well as the frequency of devastating
accidents resulting in multiple fatalities. For all these reasons, when planning
traffic safety measures in a particular area, it is important to have a comprehensive
understanding of how local conditions vary in relation to national averages.
Chapter 4.
Principal Policies for Fiscal 1998
In line with the recommendations of the Sixth Fundamental Traffic Safety Program
(FY1996-FY2000), the following key policies are being promoted:
(1) Focus on improving traffic safety facilities
In FY1998, the third year of the Seven-Year Program for Provision of Traffic
Safety Facilities, the following projects were implemented:
1) In addition to constructing wide, even and pleasant sidewalks to help prevent
accidents involving pedestrians and promoting the creation of community zones
through measures such as beautification of roads and zone-regulated traffic control
in residential areas, traffic signals were upgraded to enhance their responses
to pedestrians and the disabled, and improvements were made to street lights
and road signs.
2) To prevent accidents on school routes, improvements were made to sidewalks,
traffic signals, aboveground and underground pedestrian crossings and road signs.
3) Accidents on arterial roads tend to occur most frequently at specific sections
of roads. Acknowledging this fact, the causes of accidents at these accidents
black spots have been studied in order to develop effective measures to reduce
the risk of accidents. These measures include improvement of intersections, installation
of road lights and signals, and reviews of traffic regulations.
4) A wide range of measures has been taken to help prevent accidents involving
motor vehicles. These include upgrading traffic signals to facilitate smoother
traffic flow, improvements to intersections and junctions, construction of additional
lanes and medians, and installation of guardrails, mirrors and lights to signal
the approach of oncoming cars. In addition, road lights and speed restriction
systems have been installed to help prevent nighttime accidents.
5) As part of the Universal Traffic Management Systems (UTMS), the operation
of traffic management systems was upgraded or enhanced, through measures such
as improving central control systems and traffic information relay equipment.
(2) Improving road traffic systems with advanced communications
technology
Preparations for the nationwide introduction of the Vehicle Information and
Communication System (VICS) have been made in accordance with the Basic Guidelines
on the Promotion of Intelligent Transport System (ITS), formulated in 1996 by
five ministries and agencies. Another notable initiative was the implementation
of the Public Transportation Priority Systems (PTPS) as part of the Universal
Traffic Management Systems (UTMS) project. Trial operation of a メnon-stopモ Electronic
Toll Collection (ETC) system was held on the Tokyo Bay Aqua Line.
(3) Transportation demand management
Along with developing measures to increase traffic capacity, the Third Congestion
Mitigation Action Program (FY1998-FY2002) is promoting Transportation Demand
Management (TDM) measures. TDM aims to improve transport efficiency and level
out traffic demand across time and space through the adoption of new ways of
using roads, such as メpark and rideモ schemes, car pooling and flextime. In a
concrete implementation of these measures, 13 cities across Japan have been named
Cities Implementing Comprehensive Model Program to Mitigate Traffic Congestion
for conducting trial introductions of these initiatives with assistance from
the central government. The results of their trials are released and seminars
are organized on their findings by way of promoting the nationwide adoption of
TDM.
Furthermore, the government is assisting several cities around the country
to develop and implement plans to promote smoother traffic flow in cities, greater
traffic capacity, and enhanced comfort and convenience for city dwellers. This
initiative, referred to as Comprehensive Plans for Improving Metropolitan Traffic
Flow, combines multi-modal and TDM measures.
The government is also sponsoring the Omnibus Town Project, a scheme for promoting
city planning initiatives to make cities safer and more pleasant through more
effective utilization of bus services, which are considered friendly to people,
towns and the environment. The government has already designated the cities of
Kanazawa and Matsue as メomnibus townsモ under the project.
(4) Traffic safety education policy
As the result of revisions of the Road Traffic Law, the Public Safety Commission
has been obligated to make traffic safety education available to the public.
The Traffic Safety Education Policy was formulated and publicized to ensure that
traffic safety education is conducted effectively.
(5) Traffic safety education for elderly citizens
In order to raise awareness of traffic safety issues among elderly citizens,
the government has implemented a program called Project to Promote Safe Driving
Practices for Elderly Citizens to offer participatory, practical, hands-on learning
opportunities for elderly drivers.
To develop organizers and instructors for this type of traffic safety education,
special seminars were held throughout Japan for the municipal government officers
in charge of the project.
(6) Stricter measures for elderly drivers
The Road Traffic Law has been revised to have drivers over the age of 75 applying
for renewal of their license attend a driving course for elderly citizens, which
includes behind-the-wheel driving and driver aptitude tests.
The revised traffic law includes a regulation that prohibits cars from cutting
in the path of or encroaching upon any vehicle displaying a sign indicating that
the driver is over 75.
(7) Aggressive promotion of seat belt use
To ensure greater use of seat belts and child restraints, an aggressive public
information campaign was conducted using the mass media and a variety of promotional
activities. These activities were coupled by successful seat belt promotion strategies
based on the Selective Traffic Enforcement Program (STEP) method, which combines
education, public relations and enforcement programs.
Recently, as the need for child restraints has become more widely understood
among the public, figures are showing that the use of child restraints is now
well established. Encouraged by this, work was started on revising the Road Traffic
Law to make the use of child restraints mandatory.
(8) Education on the risks of using mobile phones while driving
Based on research into traffic accidents caused by the use of mobile telephones
while driving, efforts are being made to educate drivers about the dangers of
this practice. Drivers are made aware that the Rules of the Road (guidelines
for road and traffic behavior) strongly advise against use of mobile phones and
that they should be switched off before driving.
Another significant initiative was the formation of the Mobile Telephone Committee
representing mobile telephone companies across the nation. The committee launched
a public education campaign on mobile telephone etiquette, sponsoring advertisements
in national newspapers, distributing etiquette handbooks, and conducting surveys
on attitudes to mobile telephone habits.
(9) Comprehensive Traffic Safety Inspection
Ultimately, traffic safety is achieved by establishing a harmony between people,
roads and vehicles. Since this harmony requires contributions from road users
and the public, the government initiated a scheme ム Comprehensive Traffic Safety
Inspection ム to evaluate local road and traffic conditions in cooperation with
local people and other road users. The findings of the project, which covers
452 areas throughout the country, will be used to improve the local traffic environments.
(10) Advanced Safety Vehicle (ASV) and Automated Highway Systems
(AHS)
The Advanced Safety Vehicle (ASV) project has been promoted primarily through
a promotional group in order to commercialize ASVs equipped with an integrated
system early in the 21st century.
The AHS will provide danger warnings and driver assistance through intelligent
interactions between roads and vehicles. Research and development work is currently
on track to conclude メproof of conceptモ testing in the year 2000 and to begin
putting the technology partially into practice by around 2002.
Part 2. Railway Transport
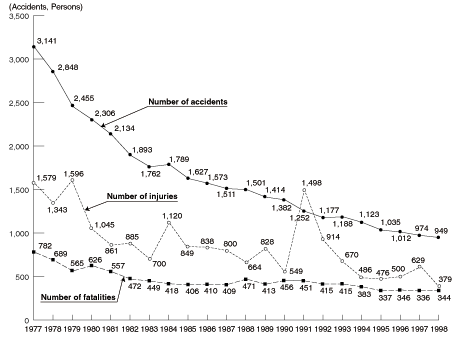
(1) Trends in railway accidents
The long-term decline in the number of railway accidents is continuing as a
result of the implementation of a comprehensive safety strategy involving the
promotion of measures to prevent level crossing accidents, installation and upgrading
of operational safety systems, improvements to control equipment and higher training
standards. In 1998 a total of 949 railway accidents occurred, resulting in 344
fatalities (See Fig. 12).
The number of level crossing accidents (487 cases) has been falling for many
years, though they still account for more than half of all railway accidents.
Looking at accidents by type, 50.7% involved destruction on level crossings,
37.1% involved human casualties, and 8.2% involved destruction on the roadway.
(2) Major railway safety measures
1) Measures to prevent railway-crossing accidents
a) A variety of railway safety enhancement initiatives have been undertaken in
accordance with
| Figure 12 |
Changes in Railway Accidents and Casualties |
| Notes: |
Source: Ministry of Transport |
|
|
the Sixth Comprehensive Crossing
Accident Prevention Measures, including construction of overpass and underpass
crossings, and making structural improvements and installing safety equipment
at crossings. At the same time, efforts are being made to consolidate roads intersecting
railway lines.
b) Public information campaigns have been stepped up to raise awareness of safety
issues among motorists and pedestrians.
2) Other traffic safety measures
a) While promoting improvements to track facilities, signal safety equipment
etc., the government is also issuing guidelines on enhanced training standards
for railway crews in the areas of basic operating procedures, adherence to duty,
operational reliability, operations management, and programming and developing
Automatic Train Stop (ATS) and Centralized Train Control (CTC) systems.
b) To strengthen the earthquake resistance of existing railway facilities and
equipment, a range of construction projects are being carried out on overhead
bridges and abutments, as well as on the central columns and bridges in メcut
and coverモ tunnels on Shinkansen (bullet train) lines and on heavily used sections
of standard railway lines. By the end of FY1997, nearly 90% of this earthquake
resistance work had been completed for Shinkansen lines and nearly 50% for standard
lines.
Also, the railway companies were informed of the new earthquake resistance
design standards developed by the government.