 Next
Next- As of October 1, 2004, the total population of Japan stood at 127.69 million, an increase of 70,000 (0.1%) from the previous year, but the number and rate of increase were both the lowest in the postwar period. The number of elderly aged 65 or older reached a new high of 24.88 million. The percentage of the elderly to the total population also increased to 19.5%. Of the elderly population, the younger-elderly population (65-74) was 13.81 million, while the older-elderly population (75 or older) was 11.07 million. (Table 1-1-1) The number of the elderly aged 100 or older nationwide recorded a new high, exceeding 23,000 at the end of September 2004. The number of the elderly aged 90 or older also exceeded one million for the first time.
Table 1-1-1. Status of Aging
| Unit: 10 thousand (population), % (rate of increase, percentage distribution) |
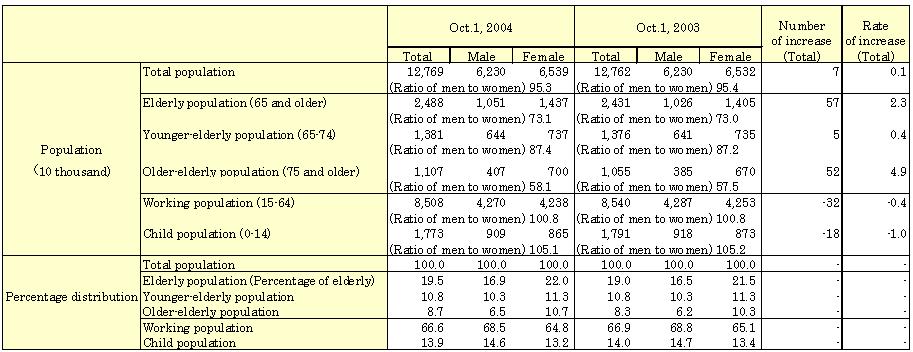
| Source: | Statistics Bureau, Ministry of Internal Affairs and Communications, "Population Estimates for Japan" (As of October 1 each year) |
| Note: | "Ratio of men to women" refers to the population ratio of males to 100 females. |
- It is estimated that the elderly population will continue to increase rapidly until 2020 and stabilize thereafter. On the other hand, while the total population is turning to a decrease, the percentage of the elderly is estimated to continue increasing, and to reach 26.0% in 2015 and 35.7% in 2050. (Chart 1-1-3)
Chart 1-1-3. Changes in Aging and Population Projections
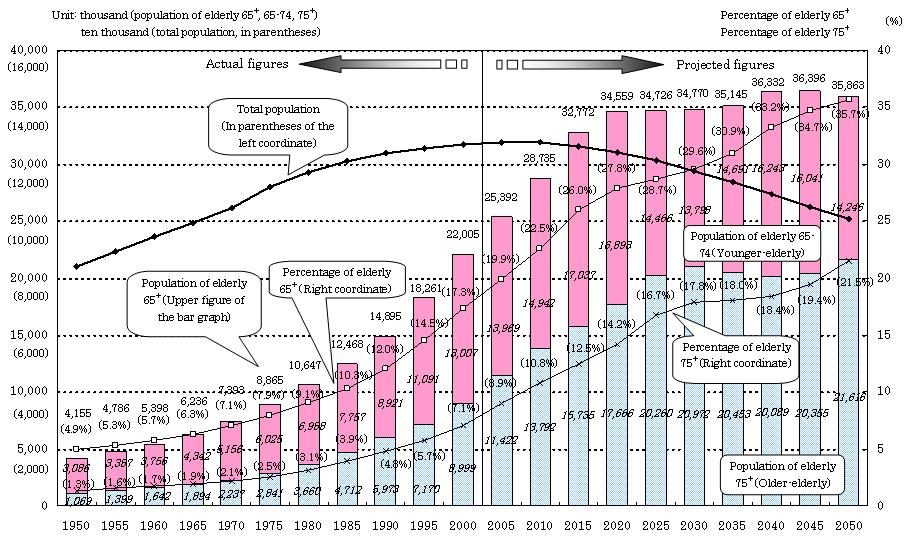
| Source: | Up to 2000: Ministry of Internal Affairs and Communications, "Population Census of Japan" After 2005: National Institute of Population and Social Security Research, "Population Projections for Japan," January 2002 |
| Note: | Regarding Okinawa in 1955, the population of persons 70+, 23,328, was divided into the age groups 70-74 and 75 or older, based on the ratio of the population 75+ to the population 70+ in the former and later years. |
- The percentage of the elderly by prefecture is low in the three biggest urban areas and high in the other areas. Shimane Prefecture is the highest, with 26.7%, and Saitama Prefecture is the lowest, with 15.5% as of 2004. It is estimated that the percentage will grow in every prefecture in the future. According to the projection, the highest will be 35.4% in Akita Prefecture, and even the lowest will reach 24.0% in Okinawa Prefecture in 2025. (Table 1-1-5)
Table 1-1-5. Trends in Percentage of the Elderly by Prefecture
|
|
| Source: | Year 1975: Ministry of Internal Affairs and Communications, "Population Census of Japan" Year 2004: Ministry of Internal Affairs and Communications, "Population Estimates as of October 1, 2004" Year 2025: National Institute of Population and Social Security Research, "Population Projections by Prefecture," March 2002 |
- Municipal distribution by the percentage of the elderly mainly concentrated on 10% or more but less than 15% in 1980 and 1985; in 2000, however, 20% or more but less than 25% was the highest with a wider distribution.
- Since World War II, average life expectancy has drastically increased in Japan; in 2003, it was 78.36 years for males and 85.33 years for females. Average life expectancy at the age of 65 was 18.02 years for males and 23.04 years for females, indicating that both old age periods are getting longer. (Chart 1-1-9)
Chart 1-1-9. Trends in Life Expectancy at Birth and Average Life Expectancy at the Age of 65
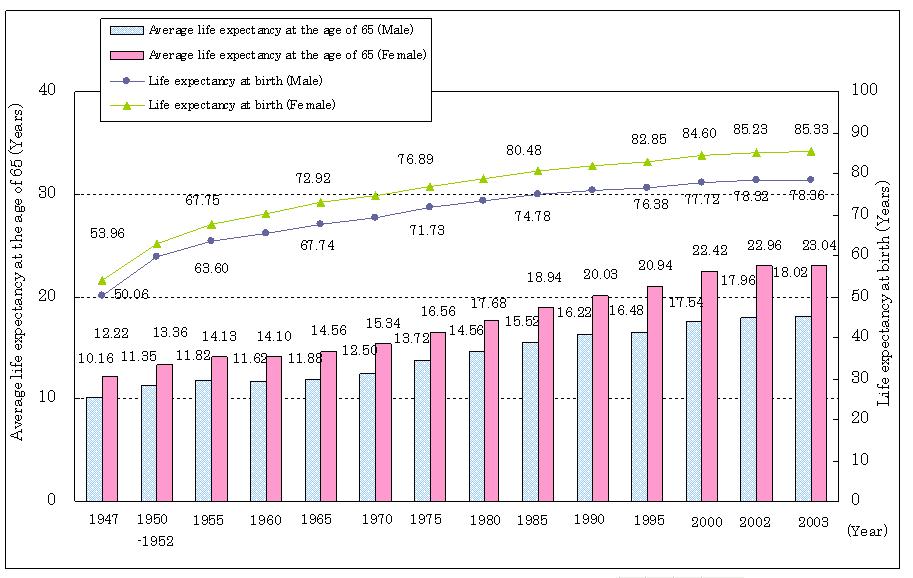
| Source: | Ministry of Health, Labour and Welfare, "Life Table (Complete Life Table)" "Abridged Life Table" for 2002 and 2003 |
- Regarding the status of birth, the total fertility rate has rapidly declined since the postwar baby boom: 2.22 in 1956, 1.91 in 1975, falling below 2.00, and in 2003 reaching the lowest at 1.29. (Chart 1-1-10)
Chart 1-1-10. Trends in Number of Births and Total Fertility Rate
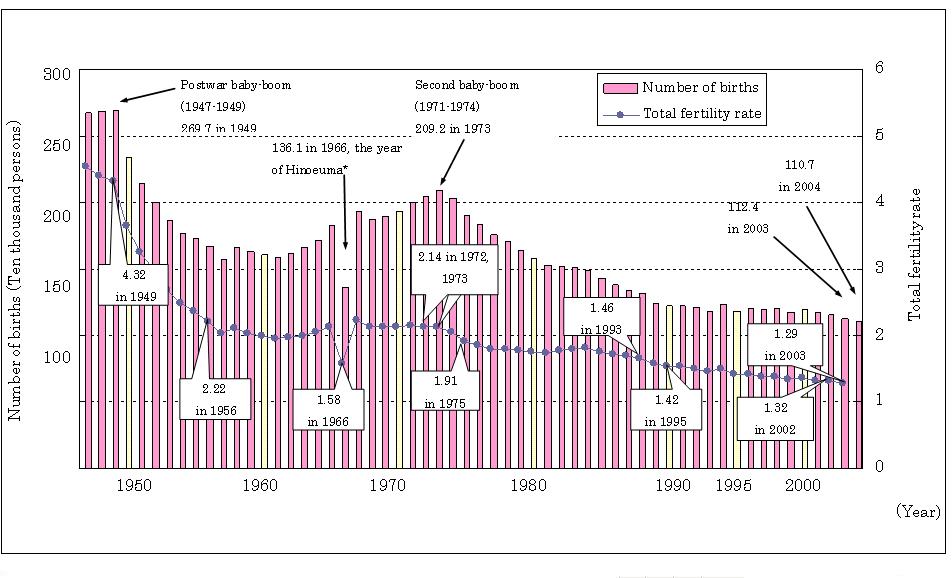
| Source: | Ministry of Health, Labour and Welfare, "Vital Statistics" |
| Note: | 1. The number of births in 2004 is an estimated figure. 2. Okinawa Prefecture is excluded in data before 1972. |
- The labour force population aged 65 or older was 4.90 million in 2004, accounting for 7.4% of the total labour force population. As the total labour force population turns to a decline in the future, their aging will probably grow even faster. (Chart 1-1-15)
Chart 1-1-15. Trends and Future Prospects of Labour Force Population
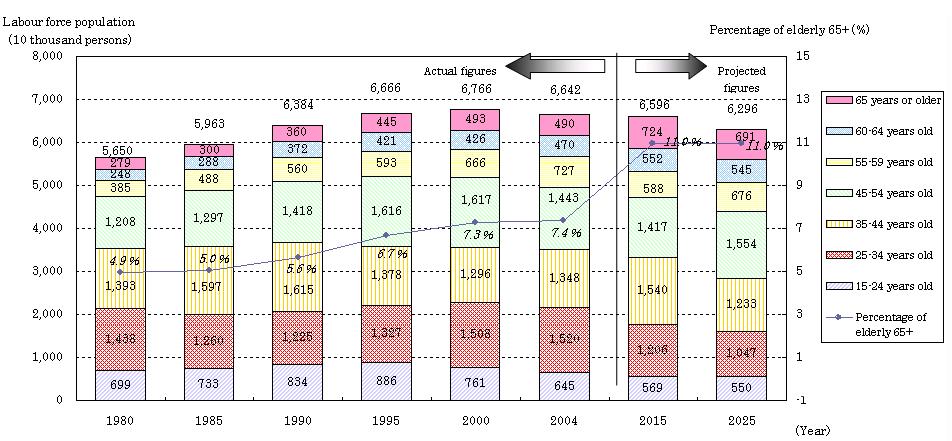
| Source: | Up to 2004: Ministry of Internal Affairs and Communications, "Labour Force Survey" After 2015: Based on the projection prepared by Ministry of Health, Labour and Welfare |
| Note: | "Labour force population" refers to the total number of the employed and unemployed aged 15 or older. |
- Social security benefits in pension, medical health, welfare, and others amounted to 83.5666 trillion yen in FY2002, 23.0% of the total national income, which was 5.8% in FY1970. The breakdown of the elderly-related benefit expenditure shows that pension insurance benefits amounted to 42.5025 trillion yen, accounting for slightly less than three-quarters of the total. (Chart 1-1-16)
Chart 1-1-16. Trends in Social Security Benefits
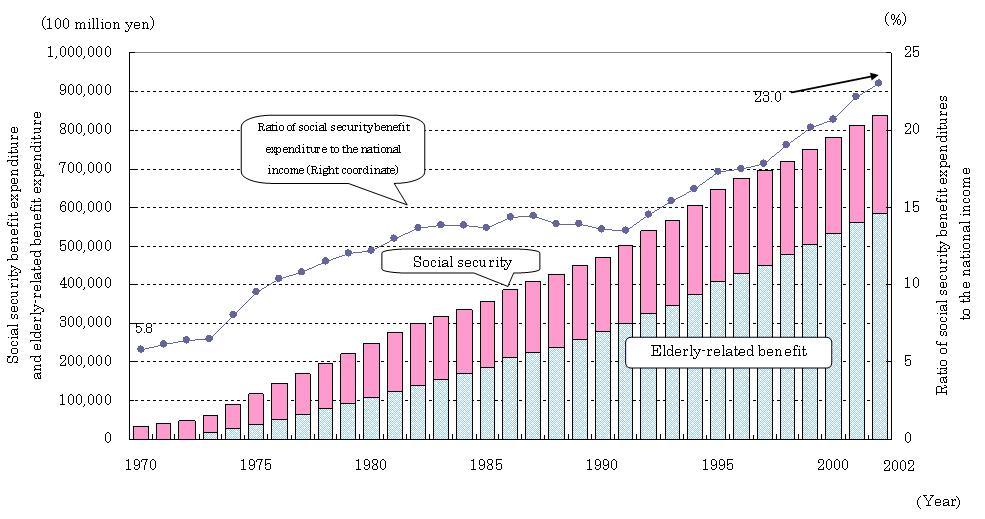
| Source: | National Institute of Population and Social Security Research, "Social Security Benefit Expenditure" |
| Note: | Elderly-related benefit expenditure includes the benefits of pension insurance, health and medical service, old-age welfare, and old-age continued employment. It has been counted since 1973. |
- The percentage of the elderly in the world is expected to increase from 7.4% in 2005 to 16.1% in 2050. Aging is estimated to grow rapidly during the first half of the century hereafter. (Table 1-1-18)
Table 1-1-18. Trends in World Population
| Year | 1950 | 2005 | 2050 |
|---|---|---|---|
| Total population | 2,519,470 | 6,464,750 | 9,075,903 |
| Population aged 65+ | 130,865 | 475,719 | 1,464,938 |
| Developed regions | 64,034 | 185,046 | 320,738 |
| Developing regions | 66,841 | 290,673 | 1,144,200 |
| Percentage of those aged 65+ | 5.2 | 7.4 | 16.1 |
| Developed regions | 7.9 | 15.3 | 25.9 |
| Developing regions | 3.9 | 5.5 | 14.6 |
| Life expectancy at birth (Male) | 45.0 | 62.5 | 72.4 |
| Life expectancy at birth (Female) | 47.8 | 67.0 | 77.0 |
| Total fertility rate | 5.0 | 2.7 | 2.1 |
| Source: | UN, "World Population Prospects," The 2004 Revision |
| Note: | 1. Life expectancy at birth and total fertility rate are 1950-1955, 2000-2005, and 2045-2050. 2. Developed regions include Europe, North America, Japan, Australia, and New Zealand. Developing regions include Africa, Asia (other than Japan), Central and South America, Melanesia, Micronesia, and Polynesia. |
- In comparison with the percentage of the elderly in developed countries, Japan was in the lower-rankings until the 1980s, in the middle in the 1990s, and is expected to be the highest in the early 21st century. (Chart 1-1-19)
Chart 1-1-19. Trends in Percentage of the Elderly in the World
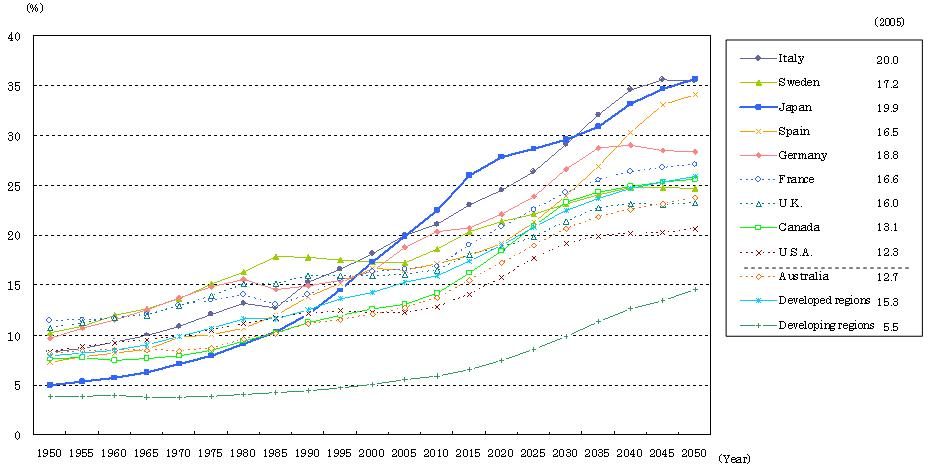
| Source: | UN, "World Population Prospects," The 2004 Revision Data for Japan is based on "Population Census of Japan" (Ministry of Internal Affairs and Communications) and "Population Projection for Japan" (National Institute of Population and Social Security Research, January 2002). |
| Note: | Developed regions include Europe, North America, Japan, Australia, and New Zealand. Developing regions include Africa, Asia (other than Japan), Central and South America, Melanesia, Micronesia, and Polynesia. |
Top Page > Annual Report on the Aging Society > Annual Report:2005

