 Back
Back  Next
Next
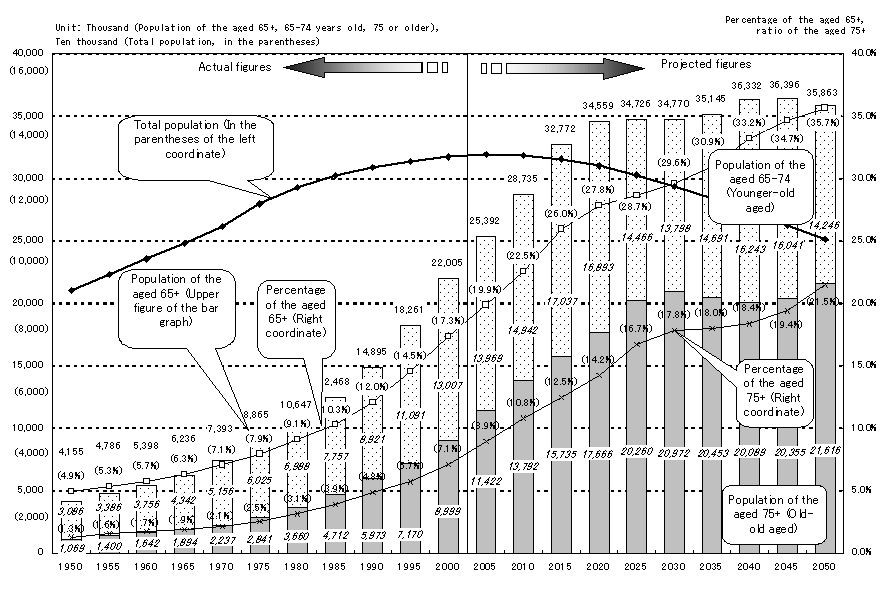
Source: Up to 2000: Ministry of Management and Coordination, ePopulation Census of Japan.f After 2005: National Institute of Population and Social Security Research, ePopulation Projections for Japan,f Jan., 2002
Note: Regarding Okinawa in 1955, the population of the persons 70+, 23,328, was divided into the age group 70-74 and 75 or older, based on the ratio of the population 75+ to the population 70+ in the former and later years.
Top Page > Annual Report on the Aging Society > Annual Report:2003