WHITE PAPER ON TRAFFIC SAFETY IN JAPAN 2005
- Japanese
- English
Abridged Edition
CABINET OFFICE
Editorial Supervision:
Directorate General for Policies on Cohesive Society, Cabinet Office
This English version of White Paper on Traffic Safety in Japan (Abridged Edition) was compiled under the supervision of Directorate General for Policies on Cohesive Society, Cabinet Office.
The International Association of Traffic and Safety Sciences hopes this paper, in conjunction with Statistics of Road Accidents Japan (Abridged Edition), will greatly enhance readers' knowledge of traffic accident remedial measures.
White Paper on Traffic Safety in Japan 2005
Cabinet Office
As required by Article 13 of the Traffic Safety Policies Law (Law No. 110 of 1970), each year the Cabinet presents its White Paper on Traffic Safety in Japan to the Diet to report on the state of traffic accidents, the effects of traffic safety measures implemented, and plans for further safety measures.
This, the 35th White Paper, is organized in the categories of land transport (road and railway), maritime transport, and air transport in line with the structure of the Seventh Fundamental Traffic Safety Program.
- IATSS
-
6-20, Yaesu 2-chome, Chuo-ku, Tokyo 104-0028, Japan
Tel: +81-3-3273-7884
Fax: +81-3-3272-7054
E-mail: mail@iatss.or.jp
URL: http://www.iatss.or.jp
Copyright © by International Association of Traffic and Safety Sciences
October 2005
Printed in Japan
CONTENTS
- PART I
TRAFFIC ACCIDENTS AND SAFETY MEASURES IN FY2004- CHAPTER 1 Land Transport
- Section 1 Road Transport
- 1 Road Traffic Accident Trends
- 2 Road Traffic Accident Statistics for 2004
- 3 Major Road Traffic Safety Measures in FY2004
- 3-1 Road environment enhancements
- 3-2 Implementation of the Traffic Safety Initiative
- 3-3 Promotion of safe driving
- 3-4 Improvement of vehicle safety
- 3-5 Preservation of order on the road
- 3-6 Enhancement of rescue systems
- 3-7 Improvement of liability security and victim support
- Focus Bolstering of the Recall System
- Focus Revision of Penalties against Mobile Phone Use and Other Dangerous Driving Behavior
- Section 2 Railway Transport
- Section 1 Road Transport
- CHAPTER 2 Maritime Transport
- CHAPTER 3 Air Transport
- CHAPTER 1 Land Transport
- PART II
TRAFFIC SAFETY MEASURES FOR IMPLEMENTATION IN FY2005
- Note:
- Since the figures in the graphs and tables were rounded to the nearest unit, the totals expressed may slightly differ from the sum of constituent figures.
PART I
TRAFFIC ACCIDENTS AND SAFETY MEASURES IN FY2004
CHAPTER 1 LAND TRANSPORT
Section 1 Road Transport
1 Road Traffic Accident Trends
1-1 Long-term trends
The annual number of fatalities resulting from road traffic accidents in Japan peaked at 16,765 in 1970.
To address concerns about the alarming death toll on the nation's roads, the Traffic Safety Policies Law was enacted in that same year. Based on the new law, in FY1971 the government began drawing up five-year plans, known as Fundamental Traffic Safety Programs, to comprehensively and systematically promote traffic safety improvements.
Annual road traffic fatalities began to fall steadily in 1971 until they were down to 8,466 in 1979. However, the yearly death toll started to rise in the following year, and continued to rise in most years until 1992, when a new declining trend began.
Changes in Road Traffic Accidents, Casualties and Fatalities
Notes: 1. |
Source: National Police Agency |
|---|---|
2. |
Figures after 1966 do not include property-damage-only accidents. |
3. |
Figures for Okinawa Prefecture were not included before 1972. |
In 2004, the number of fatalities fell even further from the preceding year's improved rate, dropping to 7,358. However, the year also recorded the worst levels ever in accidents and casualties, which rose to 952,191 and 1,190,478, respectively.
1-2 Road traffic safety objectives
The number of road traffic accident fatalities in 2004, 7,358, represented a substantial decline from the improved rate recorded in 2003.
This success can be primarily attributed to the long-running nationwide efforts to implement a comprehensive set of measures under the Fundamental Traffic Safety Programs, including enhancement of the road traffic environment, widespread improvement of safety awareness, promotion of safer driving practices, advancement of vehicle safety, preservation of orderly road usage, and improvement of rescue systems. In addition, local communities, businesses, schools, families, and other non-governmental parties are seen as having played a significant role in reducing the death toll.
Other major factors behind the recent decline in fatalities include: (1) increased usage of seat belts, (2) lower pre-accident speeds, (3) the effect of the Initiative for Stricter Drunk Driving Penalties and Other Measures against Dangerous Driving, and (4) a decline in the rate of pedestrian casualties involving violations by the pedestrian.
Nevertheless, the incidence of road traffic accidents and injuries in 2004 rose above the preceding year's levels, setting all-time highs for both categories. The overall rate of road deaths and injuries still remains at the deplorable rate of one in every 100 people.
In 2003 the government declared its goal to make Japan's roads the “safest in the world” by bringing the annual number of road deaths below 5,000 in a ten-year period. There is also the need to reduce the incidence of road accidents and injuries.
One of the most effective strategies for the coming years will be to implement a package of safety measures under the seventh installment of the highly successful Fundamental Traffic Safety Program. There is also the need to take action with regard to senior drivers, who account for the highest ratio of fatalities. Specifically, this means carrying out an extensive set of measures based on the policies outlined in “On Comprehensive Traffic Safety Measures for the Elderly toward the Transition to the Full Scale of Aging Society,” a collection of senior driver safety guidelines adopted by the Task Force on Transportation in March 2003.
Scheduled to go into action in FY2006, the Eighth Fundamental Traffic Safety Program will play a vital role in making progress toward achievement of the aforementioned goal. This program will be implemented based on the results of the seventh program and opinions provided by specialists in transportation-related fields, particularly the expert panel of the Central Committee on Traffic Safety Measures.
Focus
Selected Findings from the Policy Assessment of the Seventh Fundamental Traffic Safety Program
Below are some of the findings made by the Cabinet Office in its policy assessment of the Seventh Fundamental Traffic Safety Program (FY2001-2005), partially updated with recent data.
I. Factors behind the Recent Decline in Fatalities
The decrease in traffic accident fatalities in recent years is attributable to the success of governmental measures aimed at improving the road traffic environment, propagating stronger awareness of the concept of safety, encouraging safe driving habits, ensuring vehicle safety, preserving order on the roads, enhancing rescue and emergency care services, and implementing other improvements. In statistically definable terms, the following measures represent major factors behind the fatality rate's decline.
(1) Measures against drunk driving and other dangerous driving
In the past decade the number of fatal accidents involving drunk driving has dropped by half. The improved fatality rate of recent years can be mostly ascribed to the success of the Initiative for Stricter Drunk Driving Penalties and Other Measures against Dangerous Driving, which went into effect in June 2002.
Number of Fatal Road Accidents, by Alcohol Consumption
(as of end of each year)
Note: |
“Alcohol consumption” refers to whether alcohol was consumed prior to the accident by the primary-party driver (the driver most to blame for the accident or, when the parties involved share nearly fault, the driver that suffered the least harm). In this case, “driver” indicates operators of mopeds or other motorized vehicles. |
|---|
(2) Increased seat belt usage and the declining automobile occupant fatality rate
As shown in the graph below, the automobile occupant fatality rate (fatalities ÷ casualties × 100) has steadily declined while seat belt usage has risen. This suggests that the greater use of seat belts has helped to lower the fatality rate.
Seat Belt Usage and Automobile Occupant Fatality Rate
(as of end of each year)
Notes: 1. |
Seat belt usage = seat belt-wearing automobile occupant casualties ÷ total automobile occupant casualties × 100 |
|---|---|
2. |
Automobile occupant fatality rate = automobile occupant fatalities ÷ automobile occupant casualties × 100 |
(3) Lower hazard recognition speeds and the decline in fatalities
In terms of the hazard recognition speed (speed immediately before accident), the fatal accident rate was 0.4% for vehicles traveling at or under 50 km/h, 5.2% for over 50 km/h to 80 km/h, and 22.4% for over 80 km/h, indicating that the fatality rate rises with speed. As suggested by the graph below, the decline in pre-crash speeds can be considered a factor behind the decrease in fatalities.
Number of Traffic Accidents (by Hazard Recognition Speed) and Fatalities
(as of end of each year)
Notes: 1. |
“Hazard recognition speed” refers to the speed at which an automobile or moped is traveling when the driver notices the hazard (moving or parked vehicle, pedestrian, safety barrier, utility pole or other obstacles, etc.). |
|---|---|
2. |
The accident rate is for accidents occurring on general roads. |
(4) Decreased violation-related pedestrian casualties and the decline in pedestrian fatalities
As indicated by the graph below, it can be inferred that the decrease in the percentage of violation-committing pedestrians is a factor in the declining number of pedestrian fatalities.
Violation-committing Pedestrian Casualties and Pedestrian Fatalities
(as of end of each year)
Notes: 1. |
Pedestrian violation rate = violation-committing pedestrian casualties ÷ total pedestrian casualties × 100 |
|---|---|
2. |
The pedestrian violation rate excludes accidents where the vehicle was a bicycle or other light vehicle. Both primary-party and secondary-party pedestrians are included. |
(5) Decrease in deadly head-on collisions
In recent years, the incidence of rear-end collisions and other types of accidents with low fatality rates has risen, but the frequency of head-on collisions and other crashes with high fatality rates has declined in some cases or remained mostly unchanged in others. A variety of factors are believed to be responsible for the decrease in head-on collisions, one of which is the enhancement of the traffic safety infrastructure. This is exemplified, as shown in the graph below, by how the number of fatal head-on crashes has declined as more road medians have been constructed or extended.
Median Construction/Extension and Fatal Head-on Collisions
II. Assessment of Policies
In assessing the Seventh Fundamental Traffic Safety Program, the Cabinet Office determined that the program's traffic safety measures were effective in lowering the number of fatalities. For example, the goal of reducing the annual, 24-hour number of fatalities below 8,466 was achieved in the second fiscal year of the program. Moreover, the number of fatalities was brought below half of the 1970 level of 16,765.
One of the specific policies identified as a key factor in this reduction was the Initiative for Stricter Drunk Driving Penalties and Other Measures against Dangerous Driving. Following enactment of the Revised Road Traffic Law (June 2002), which includes the Initiative as one of its pillars, a significant decline occurred in the incidence of fatal accidents resulting from drunk driving, a major cause of deadly and otherwise serious accidents. It is thus believed that the revised legislation played an important role in reducing fatalities.
However, it goes without saying that the improved fatality rate was also the result of other policies, including measures aimed at improving the road traffic environment, propagating stronger awareness of the concept of safety, encouraging safe driving habits, ensuring vehicle safety, preserving order on the roads, and enhancing rescue and emergency care services.
Another notable finding made in the assessment is that safety measures related to the elderly seem to have performed inadequately. Although success has been achieved in reducing the number of senior fatalities, there has been a rise in the proportion of elderly people among all fatalities, and in the number of accidents in which seniors were the primary-party drivers (as operators of mopeds or other motorized vehicles). Since it takes some time for the effectiveness of safety measures to be demonstrated, the Cabinet Office has determined that it will be vital to step up the implementation of the various safety strategies based on the Task Force on Transportation's “On Comprehensive Traffic Safety Measures for the Elderly toward the Transition to the Full Scale of Aging Society.” In addition, the Cabinet Office feels that since the number of road accident casualties has, unlike the number of fatalities, failed to decline, it is impossible to declare successful achievement of the goal to reduce the per-automobile number of casualties as much as possible. Consequently, further examination needs to be given to policies for preventing traffic accidents themselves.
Focus
Traffic Safety Awareness Survey
In FY2004, the Cabinet Office conducted a questionnaire survey on traffic safety awareness in order to collect information for developing the Eighth Fundamental Traffic Safety Program. Below is an overview of the survey.
- Survey method
Survey staff members visited the home of each respondent to deliver a questionnaire and explain its content. Several days after delivery, the surveyors made another round of visits to collect the questionnaires. At that time they checked whether the respondents had appropriately replied to the questions, and requested responses to any unanswered items. - Target
The survey targeted male and female individuals aged 16 and older who fit the qualifications for holding a two-wheeled vehicle license. The respondents were selected nationwide at random using stratified multistage sampling of Basic Resident Registers. - Samples: 2,105 questionnaires were collected.
- Period: Dec. 9-17, 2004
Major Results
1. Traffic safety awareness
- (1) Perceptions of traffic accidents
- Overall, the most frequently indicated response (76.5%) regarding perception of traffic accidents was “It is difficult to completely eliminate traffic accidents, but they should be reduced significantly.” This was followed by “Traffic accidents can and should be completely eliminated” (18.2%). This level of awareness suggests that pro-active implementation of traffic safety measures can reduce accidents. (See Figure 1.)
- (2) Perceptions of accident trends
- Nearly half of the respondents replied that they think the trend in traffic accidents is headed in the negative direction. It may be that this attitude is more heavily influenced by the increases in traffic accidents and casualties than by the decrease in fatalities. (See Figure 2.)
Figure 1: Which of the following best represents your perception of traffic accidents? (single response)

- (3) Current safety measures considered highly effective
- Of the various safety measures currently being implemented, “effective guidance and enforcement” was the one most often selected by the respondents as being highly effective (63.9%). The second most common response was “thorough enforcement of seat belt and child safety seat usage” (58.3%). These results, juxtaposed with the low ranking of “promotion of citizen-involved traffic safety programs,” suggest that the public takes a passive attitude toward traffic safety. (See Figure 3.)
Figure 3: Which of the following measures do you think are highly effective? (three choices)
- (4) Traffic safety measures considered important for the future
- With regard to traffic safety measures considered important for the future, the most common response was “improvement of the road traffic environment” (73.5%), which was selected nearly twice as often as the second-ranked response, “preservation of order on the roads” (36.8%). In comparison with the results shown in Figure 3 (assessment of current measures), the rate of selection for “improvement of the road traffic environment” was much higher as a future concern than as a current subject of interest (73.5% versus 49.8%). It can be inferred from this that there are high expectations for the future implementation of this measure. (See Figure 4.)
Figure 4: Which of the following measures do you think are important for the future? (three responses)
2. Road accident risk
When asked to state the daily amount of time they spend on the road, the largest percentage of respondents indicated “at least 1 hour but less than 2 hours” (36.2%). The second most frequent response was “less than 1 hour” (21.8%). The average time for all respondents who gave a reply was 2 hours, 0 minutes. (See Figure 5.)
Based on the results of this survey, the risk of dying in a traffic accident (“road risk”) computes to be nearly 4.2 times larger than the risk of dying in an off-road accident (“offroad risk”).
Total accident fatalities: 38,714 (Ministry of Health, Labor and Welfare, 2003)
Road traffic accident fatalities: 10,645 (computed from MHLW data)
When time asleep (7 hours and 42 minutes, as determined in 2001 for population 15 and older by the Ministry of Internal Affairs and Communications) is subtracted from time spent on off-road activities, the risk ratio computes as:
2 Road Traffic Accident Statistics for 2004
2-1 Overview
| Road traffic accidents | 952,191 |
|---|---|
| Casualties (Fatalities + Injuries) | 1,190,478 |
| Injuries | 1,183,120 |
| Fatalities (within 24 hours of the accident) | 7,358 |
| Fatalities (within 30 days of the accident) | 8,492 |
2-2 Casualties: By age group
People aged 65 and older had the largest number of road fatalities of any age group, 3,046, accounting for more than 40% of all fatalities. This was the twelfth year in a row that this segment has remained at the top.
Compared with the preceding year, the number of fatalities declined for all age groups, except the 30-39 bracket. The decrease was largest for the 16-24 range (down 108).
The number of injuries was highest for 16-24 year-olds, 230,506, representing 19.5% of the total. Compared with 2003 figures, injuries sharply decreased for the 16-24 group (down 9,419) and the 25-29 group (down 5,184), but drastically rose for the 30-39 group (up 6,914) and the 65 and older group (up 4,342).
Changes in Traffic Accident Fatalities, by Age Group
Notes: 1. |
Source: National Police Agency |
|---|---|
2. |
Figures in parentheses show percentage (%) of fatalities by age group. |
Changes in Traffic Accident Injuries, by Age Group
Notes: 1. |
Source: National Police Agency |
|---|---|
2. |
Figures in parentheses show percentage (%) of injuries by age group. |
2-3 Casualties: By mode of transportation
In terms of the mode of transportation used by the accident victim, automobile occupants accounted for the largest number of fatalities, 2,918 (39.7% of total), and the largest number of injuries, 735,987 (62.2% of total).
Changes in Traffic Accident Fatalities, by Mode of Transportation
Notes: 1. |
Source: National Police Agency (figures for “Other” omitted) |
|---|---|
2. |
Figures in parentheses show percentage (%) of fatalities by mode of transportation. |
Changes in Traffic Accident Injuries, by Mode of Transportation
Notes: 1. |
Source: National Police Agency (figures for “Other” omitted) |
|---|---|
2. |
Figures in parentheses show percentage (%) of injuries by mode of transportation. |
2-4 Fatalities: By seat belt usage
A total of 1,592 automobile occupants were killed in accidents while not wearing seat belts. This represented a decrease of 83 (5.0%) from the preceding year.
The fatality rate (ratio of fatalities to total casualties) for seat belt wearers was approximately eleven times lower than that for non-wearers.
Changes in Automobile Occupant Fatalities, by Seat Belt Usage
Notes: 1. |
Source: National Policy Agency |
|---|---|
2. |
Figures in parentheses show percentage (%) of fatalities by seat belt usage. |
Changes in Automobile Occupant Fatality Rates, by Seat Belt Usage;
Usage of Seat Belts by Automobile Occupant Casualties
Note: |
Source: National Police Agency |
|---|
2-5 Child fatalities and child safety seat usage
A total of 41 children under age six were killed while riding in an automobile, up 10 from the level of the preceding year. Of the 15 deaths that occurred in vehicles not heavily damaged, 3 children were restrained in child safety seats, and 12 were not.
2-6 Annual, weekly, daily accident/fatality peaks
The month with the highest number of accidents and fatalities was December.
Fatal accidents occurred more frequently on Saturday than on other days.
Nighttime accidents accounted for 28.1% of all accidents, and for 52.1% of all fatal collisions. The nighttime fatality rate (fatal crashes per 1,000 accidents) was 2.8 times higher than that for the daytime.
2-7 Fatal accidents caused by primary party
The number of fatal accidents in which automobile drivers are the primary party1 continued its slow downward trend. However, the number of primary-party drivers aged 65 and older was 2.91 times the level in 1989.
1The party most to blame for the accident, or, when the parties involved share nearly equal fault, the party that suffered the least harm.
Changes in Fatal Accidents Caused by Primary-party Automobile Drivers (Young and Elderly)
Notes: 1. |
Source: National Police Agency |
|---|---|
2. |
Index figures are based on 1989 (= 1). |
3 Major Road Traffic Safety Measures in FY2004
3-1 Road environment enhancements
- Promotion of the Provision of Traffic Safety Facilities
- In FY2004 the government aggressively pursued the following projects for enhancing the traffic safety infrastructure, in line with the “Priority Plan for Social Infrastructure Development.”
- (1) Intensive accident prevention measures were implemented at intersections and road sections that were designated as “black spots” in 2003 for having a high incidence of casualty-inflicting accidents. Aimed at reducing the number of these accidents at each site by approximately 30% by FY2007, this project was supported by prefectural public safety commissions and road management agencies. In addition, the project team created a “Road Safety Manual for Hazardous Spots”1 implemented scientific measures against accidents in black spots and other dangerous areas, and developed an accident countermeasure database.
- (2) In the Safe Pedestrian Area project, the coordinators, with the cooperation of prefectural public safety commissions and road management agencies, continued to implement comprehensive, wide-area accident prevention measures in residential and commercial districts that were designated as target areas in 2003 for having high accident casualty rates. The goal of the program is to reduce casualty-inflicting accidents in the designated areas by approximately 20% overall and approximately 30% for pedestrians and bicycle riders by FY2007.
- (3) In order to help seniors and disabled people lead independent, socially active lives, projects were implemented to develop broad, level walkways and install barrier-free signals in areas around train stations and other public facilities. Other efforts included the elimination of utility poles, conversion of traffic signals to LED lighting, and enhancements to road signs and markings to make them more visible to elderly motorists.
1This manual is a systematic compilation of procedures, points of consideration, and other matters related to the entire process of traffic safety measure implementation, from proposal to assessment. It is based on the results of accident countermeasures previously implemented under the Black Spot Emergency Measures Program and other projects.
- Development of Intelligent Transport Systems
- In accordance with the Comprehensive ITS (Intelligent Transport Systems) Initiative formulated in 1996, R&D, field tests, infrastructural development, and other endeavors were carried out to develop ITS, which use advanced information technology to integrate people, roads, and vehicles into a unified system to improve safety, transport efficiency, and other aspects of road traffic.
- (1) Further progress was achieved with the deployment of VICS (Vehicle Information and Communication System), which provides real-time information on traffic congestion and other travel conditions to automobile navigational systems. As a result of this effort, the number of VICS-compatible navigational units climbed above the ten million mark by the end of July 2004.
- (2) Progress has also been made in the UTMS (Universal Traffic Management Systems) project, which is aimed at preserving road safety and convenience through active, comprehensive management of traffic flow and volume. Advances include system enhancements and deployment of roadside infrared beacons, which measure traffic and relay information between navigational devices and traffic control centers.
In addition, the project team performed a demonstration experiment of a new signal control system at the 11th ITS World Congress, which was held October 18-24, 2004 in Nagoya. The demonstration showcased the new technology to visitors from around the world, and helped perk interest in ITS. - (3) R&D efforts continued to be focused on the rapid development and deployment of a triad of innovative road technologies: ITS-compliant next-generation “smartway” roads, “smart gateways” for advanced communication between automobiles and roadside systems, and high-speed “smart cars.”
3-2 Implementation of the Traffic Safety Initiative
- Traffic safety education for seniors
-
With the cooperation of local governments and organizations, a variety of traffic safety education programs were offered to seniors who do not hold driver's licenses, attend social clubs, or engage in other public activities that provide opportunities to receive safety guidance. These community-based programs included visits by instructors to the residences of elderly people living along roads with a high incidence of traffic accidents, and traffic accident prevention advice given through doctors and other professionals who have frequent contact with seniors.
In addition, projects were pursued to improve safety awareness among the elderly through peer-to-peer instruction, such as efforts to actively promote the establishment of traffic safety committees at seniors' clubs and nursing homes, and the training of Silver Leaders (instructors who provide safety education to seniors). Other such projects included the creation of “Hiyari Maps” (maps of near-miss spots) with the involvement of seniors' clubs, and the provision of guidance and assistance to locally led initiatives, such as hands-on training courses for senior motorists and seminars on the safe use of electric wheelchairs, which are recently becoming more prevalent.
The “Citizen-involved Project to Promote Traffic Safety Education for Seniors” was continued to train Silver Leaders as promoters of sustained safety education for seniors that is oriented toward involvement, hands-on experience, and personal practice. In addition, the program coordinators launched a new initiative, the “Central Training Program for Silver Leaders,” to improve Silver Leaders' skills in nurturing new sub-leaders. The coordinators also ran the ongoing “Traffic Safety Awareness Program for Seniors,” which included the “Crossgeneration Sharing Project,” in which people of all generations gathered to share their knowledge and concerns regarding traffic safety, as well as the “Senior Home Visit Project,” in which traffic safety guidance is provided at home to seniors unable to attend safety seminars.
Awareness-raising efforts aimed at ensuring that proper safety advice is given at the home were made through the Traffic Safety Mothers and other groups.
- Education on seat belt and child safety seat usage
-
Efforts were made to raise awareness regarding the benefits of seat belts and provide instruction on their correct usage through various outlets, such as traffic safety seminars and campaigns.
In response to the common problem of incorrectly fastened child safety seats, promotional activities were conducted in conjunction with the spring and fall Nationwide Traffic Safety Campaigns and other events, and workshops on correct usage were sponsored at obstetrics/ gynecology clinics, kindergartens, nursery schools, and other venues.
3-3 Promotion of safe driving
- Enhancement of measures for senior drivers
- All drivers aged 70 and older are required to attend senior drivers' courses, which require participants to operate an automobile and undergo testing with aptitude testing machines. The purpose of these courses is not only to check the participants' driving abilities, but also to have them directly recognize changes that have occurred in their physical faculties. The participants are also given advice and guidance based on the results of their evaluations. These courses were attended by 1,263,372 seniors in 2004.
3-4 Improvement of vehicle safety
- Improvement of vehicle recall systems
- The government strengthened its efforts to monitor vehicle safety by bolstering its system for collecting vehicle defect information from users via a hotline service and accident information from the police, JAF, and other relevant organizations, and by conducting focused audits of suspect manufacturers. In addition, the government established a recall investigation office and created a system for corroborative testing.
3-5 Preservation of order on the road
- Tougher measures against motorcycle gangs
- The government toughened its laws with respect to motorcycle gangs, including regulations prohibiting dangerous group activity, and held a “Motorcycle Gang Crackdown Period” in June.
- Enacted in November 2004, the “Law to Partially Revise the Road Traffic Law” (Law No. 90 of 2004) implemented a number of changes to control dangerous behavior by motorcycle gangs, including making annoying acts subject to punishment even when no lives are put to risk, toughening penalties against operating a vehicle without a functioning muffler, and establishing penalties for noisy driving. In response, authorities began cracking down on violations of the new regulations.
3-6 Enhancement of rescue systems
- Emergency life guard training
- As of the end of 2004, there were 27,365 people qualified as emergency life guards capable of handling airway management, establishing IV lines, and performing other physician-directed first aid techniques on cardiopulmonary arrest victims en route to a medical center.
- Expansion of emergency contact system
- In accordance with the UTMS (Universal Traffic Management Systems) project and other initiatives, efforts were made to accelerate rescue and cleanup responses to traffic accidents and other road emergencies by further expanding HELP (Help systems for Emergency Life saving and Public safety), a GPS-based system designed to improve the rescue success rate by allowing accurate accident information (location, etc.) to be instantly sent via mobile phones and other communicators.
- In order to reduce the response time and collision risk of ambulances en route to accident sites, work was continued on the development of FAST (Fast Emergency Vehicle Preemption Systems) for assisting emergency vehicle drivers, including automatic control of traffic signals to give them immediate right-of-way.
3-7 Improvement of liability security and victim support
- Promotion of accident victim support measures
- This project is aimed at aiding traffic accident victims by developing a safe, stress-free traffic environment based on the public's mutual support. Project activities include: (1) creation of manuals and videos for support providers, (2) development of systems and networks to support the establishment of self-help groups to help victims recover from emotional trauma, and (3) sending of project specialists overseas to receive advanced training.
Focus
Bolstering of the Recall System
1. Recall system overview
The government's system for automobile recall identifies certain automobile models whose structure, parts, or functions are non-compliant or are suspected of being non-compliant with the Road Trucking Vehicle Law Safety Standards, a set of standards for preserving road safety and protecting the environment. When the cause of the flaw lies in the design or manufacturing process, the government orders the manufacturer to make the necessary ameliorations to vehicles already sold to bring them up to standard.
2. Number of recall reports
In FY2004 automakers filed 438 recall reports for nearly 7,570,000 defective vehicles. Both numbers represent the highest figures recorded since the government began requiring the reports in 1969, and drastically surpassed the previous record-breaking levels of FY2003 (204 reports, approx. 4,420,000 vehicles). It should be noted, however, that this rise was influenced in part by the discovery of defect cover-ups, falsified reporting, and other illegitimate activity perpetrated by a certain automaker.
Number of Recall Reports and Number of Vehicles Affected
3. Measures to prevent illegitimate practices
In January 2003, the Ministry of Land, Infrastructure and Transport established a recall order system, additional penal measures, and larger fines as part of an effort to ensure proper recall of defective vehicles. When the ministry discovered last year that an automaker guilty of illegitimate practices regarding flawed vehicles in 2000 had once again committed recall violations, it decided to implement the following measures to make the recall system work quicker and more effectively.
- (1) Enhancement of information gathering
- Obligation for vehicle manufacturers to regularly report vital safety-related information
- Sharing of information between the National Police Agency, JAF, public road corporations, vehicle safety-related agencies in other countries, etc.
- Improvement of ability to collect information from users by publicizing the government's defect hotline
- (2) Reinforcement of auditing system
- Strengthening of intensive audits of suspect manufacturers, focused audits based on comprehensive data analysis, dealer audits, etc.
- (3) Performance of technical testing
- In addition to document inspection, perform checking and testing of suspect vehicles at the National Traffic Safety and Environment Laboratory
- (4) Development of empirical defect review system
- Development of a system in which experts conduct empirical, overall review and assessment of vehicle problems suspected to result in fatal accidents, vehicle fires, etc.
Focus
Revision of Penalties against Mobile Phone Use and Other Dangerous Driving Behavior
Promulgated on June 9, 2004, the Law to Partially Revise the Road Traffic Law (Law No. 90 of 2004) includes among its changes a new set of penalties for mobile phone use while driving, tougher measures against motorcycle gangs, and stricter penalties against drivers who refuse to take sobriety tests. The following is a description of the content and enforcement of some of these revisions, which took effect on November 1, 2004.
1. Revisions
(1) Revised penalties against mobile phone use and other distractions to driving
In response to the growing problem of automobile and moped operators using mobile phones or other distracting devices while driving, the government revised the Road Traffic Law in 1999 to include a regulation prohibiting drivers from using wireless communication devices for conversation or fixing their eyes on image display devices while the vehicle is in motion. In addition, the revision stipulated that violators causing a traffic hazard were to be imprisoned for up to three months or fined up to ¥50,000.
Immediately after the revision went into force on November 11, 1999, there was a sharp decline in accidents resulting from the use of mobile phones or other distracting devices. However, the deterrent effect of the tougher legislation eventually began eroding, with the number of such accidents in 2003 rebounding to a level nearly double that of 2000. Consequently, the new revisions now stipulate a fine of up to ¥50,000 for simply holding a wireless communication device to engage in conversation or holding an image display device and fixing one's eyes on the screen.
Moreover, violations are now subject to the Traffic Infraction Notification System, in which infraction fees are levied at a rate of ¥7,000 on large motor vehicle operators, ¥6,000 on ordinary automobile/motorcycle operators, and ¥5,000 on moped operators.
(2) Tougher measures against motorcycle gangs
The revised law prohibits the act of reckless driving in groups, and subjects violators to immediate arrest. Also, it establishes penalties for jackrabbit starts, sudden acceleration, repeated engine revving, and other noisy behavior, and toughens the existing penalties for operating a vehicle without a functioning muffler.
(3) Stricter penalties against sobriety test refusal
Another change implemented in the revised law is the establishment of stricter penalties against drivers who refuse take sobriety tests.
2. Enforcement of new revisions (effective Nov. 1, 2004)
(1) Number of violations (first 5 months)
| Nov. 2004-Mar. 2005 | Change from same time in preceding year | |
|---|---|---|
| Prohibited use of mobile phone, etc. (holding)* | 114,627 violations | - |
| Sobriety test refusal | 207 violations | +25 violations |
| Reckless group behavior, etc. | 110 violations, 1,434 persons (immediate arrests: 97 persons) |
+27 violations +30 persons |
| Portion subject to revised regulations | 83 violations, 600 persons (immediate arrests: 97 persons) | - |
| Noisy vehicle operation | 73 violations | - |
| Lack of functioning muffler | 1,131 violations | -84 violations |
*Note: |
Data for Nov. and Dec. 2004 are from special surveys conducted by each prefecture. Data for Jan.-Mar. 2005 were compiled by the National Police Agency. |
|---|
(2) Number of accidents related to mobile phone use while driving (first 2 months)
| 2004 | 2003 | |||
|---|---|---|---|---|
| Nov. | Dec. | Nov. | Dec. | |
| Accidents | 108 | 109 | 202 | 221 |
| Fatalities | 2 | 2 | 1 | 5 |
| Injuries | 136 | 139 | 308 | 280 |
Section 2 Railway Transport
1 Railway Traffic Accident Trends
The number of railway operational accidents1 has continued its long downward trend, with 782 incidents occurring in 2004. This steady decline can be attributed to the success of a comprehensive set of safety initiatives, including the implementation of measures for preventing crossing accidents, the installation and upgrading of operational safety systems, improvements to controllers, and higher crew training standards.
A total of 663 casualties (including 299 fatalities) resulted from the operational accidents, representing an 11.0% drop from the preceding year.
Almost half of the operational accidents occurred at crossings (373), but this figure has been decreasing over the long run.
There were two major accidents during the year, a JR West derailment on June 2, and a Kosaka Seiren derailment on November 9.
Changes in Railway Operational Accidents and Casualties
Notes: 1. |
Source: Ministry of Land, Infrastructure and Transport |
|---|---|
2. |
Fatalities are defined as deaths occurring within 24 hours of an accident. |
1 “Railway operational accidents” refers to train collisions, derailments, fires, crossing accidents, road accidents, human accidents, and damage to railway structures. In this White Paper, the definition of “railway transport” also encompasses streetcar transport.
Postscript: Two major accidents occurred in March 2005: a derailment on Tosa Kuroshio Railway's Sukumo Line, and a crossing accident on Tobu Railway's Isezaki Line. The details are as follows.
-
Tosa Kuroshio Railway accident: At around 8:41 p.m. on March 2, a 3-car express failed to brake as it arrived at Sukumo Station (the terminus), ran over a train barrier, and collided with a station wall, resulting in the derailment of the first two cars, the death of the driver, and injuries to nine passengers and the conductor.
On March 3, the Ministry of Land, Infrastructure and Transport (MLIT) issued a notice to relevant railway operators, advising them to take steps to prevent similar accidents from occurring by inspecting their terminal protection systems and their train operation at terminal stations, and by taking other actions necessary to ensure safety. On March 29, MLIT issued a second notice to the operators to request them to formulate and promptly implement plans for upgrading the function of Automatic Train Stop (ATS) systems at the terminuses of railway sections where high-speed travel occurs.
-
Tobu Railway accident: At around 4:50 p.m. on March 15, the operator of a manually controlled crossing gate at Takenotsuka Station, opened the gate as a train approached. The train hit four pedestrians in the crossing, killing two and injuring the other two.
On March 16, MLIT sent notices to operators of railways with manually operated crossing gates, instructing them to exercise greater caution to prevent similar accidents in the future. In addition, MLIT advised them to develop, through discussion with local authorities, appropriate measures for running Class 1 manually operated crossings that often stay closed for long periods due to heavy railway traffic.
Focus
The JR West Fukuchiyama Line Derailment
On April 25, 2005, a catastrophic derailment occurred on the Fukuchiyama Line operated by West Japan Railway Co. (JR West), killing 107 people and injuring 460 others (as reported by the Fire and Disaster Management Agency, April 30).
1. Accident
At approximately 9:18 a.m. on April 25, the first five cars of a 7-car, rapid-service commuter train traveling between Amagasaki Station and Tsukaguchi Station on the Fukuchiyama Line derailed and collided with the ground-level portion of an apartment building on the left side of the tracks.
2. Response by Authorities
Immediately following the accident, MLIT established at its Kinki District Transport Bureau a “Fukuchiyama Line Accident Task Force” (led by the bureau's Director-General), and dispatched two bureau officers to the site of the derailment. MLIT also set up another Fukuchiyama Line Accident Task Force (led by the Minister) at its headquarters, and the Minister, the Parliamentary Secretary, the Railway Bureau's Director-General, and two officers went to the accident scene. The Parliamentary Secretary remained at the site to coordinate the ministry's response until rescue operations ended on April 28.
In the days up to and including April 28, more than 1,000 man-days were spent on the extraction and evacuation of the victims. The rescue workers included members of the Amagasaki Fire Department, various fire headquarters in Hyogo Prefecture, and emergency fire and rescue units of neighboring prefectures that were dispatched by the Fire and Disaster Management Agency's Director-General in response to a call for assistance from the Governor of Hyogo Prefecture.
The National Police Agency created its own task force, which began coordinating between the relevant prefectural police departments regarding special deployment of their interprefectural emergency rescue units. Guided by these coordinating efforts, the Hyogo Prefectural Police assisted rescue operations, controlled area traffic, and provided victim support with a force representing nearly 6,800 man-days (in the days up to and including April 28). The police personnel included members of Osaka Prefecture's interprefectural emergency rescue unit. The Hyogo Prefectural Police also set up an investigative task force that started looking into the cause of the accident on April 25.
The Ministry of Health, Labor and Welfare helped to track hospital availability and coordinate transportation of injured survivors. The Osaka National Hospital and the Japanese Red Cross Society dispatched medical teams and relief squads to the accident site.
Authorities started providing emotional care to the survivors through doctors and mental health counselors at hospitals and other venues, and are implementing measures for continued medical and psychological care.
The Aircraft and Railway Accidents Investigation Commission sent two Members of the Commission and five accident investigators to the site on April 25 to determine the cause of the accident. On April 26, two more Members of the Commission and one technical adviser were added to the on-site team.
On April 25, MLIT issued to JR West a warning concerning its failure to maintain railway safety, and sent notices to operators of public land, maritime, and air transport services advising them to thoroughly implement safety measures.
On April 28, MLIT ordered JR West to formulate a safety improvement plan, and created a ministry team for studying measures to prevent the occurrence of similar derailments in the future.
On May 6, MLIT issued notices to public and major private railway operators (including JR) directing them to carry out full inspections of their timetables, trains, Automatic Train Stop (ATS) systems, and other railway equipment.
On May 9, MLIT's Fukuchiyama Line Accident Task Force resolved that MLIT should require the improvement of ATS systems to prevent speeding at sharply curved sections of railways, and should launch a study of the system of railway driver qualifications.
2 Major Railway Traffic Safety Measures in FY2004
2-1 Railway environment enhancements
- Inspection and enhancement of railway structures
- In order to prevent damage to railway structures from landslides, falling rocks, avalanches, and other natural forces, this program promoted the enhancement of disaster prevention systems, and called upon railway operators to regularly perform maintenance and repairs.
- In order to ensure safe travel on smaller regional lines, the operators were asked to maintain and repair facilities and trains in accordance with a safety enhancement plan that was formulated based on the results of an emergency safety assessment conducted in FY2002 and 2003.
- In another effort, the elimination of mobility barriers at railway stations was further promoted to improve the level of safety for seniors and disabled people. This included the elimination of bumps and level differences, and the installation of fall prevention fittings.
- Reinforcement of earthquake resistance
- In order to ensure the earthquake resistance of railway structures, railway operators were instructed to comply with the Earthquake Resistant Design Code (1998) with regard to current and future construction projects, and reinforce the earthquake resistance of existing structures, including railway overpasses.
- Promotion of subway fire prevention measures
- Operators of subway stations not compliant with the Standards for Fire Prevention in Subways as of the end of FY2003 were ordered to implement the enhancements necessary for bringing the stations into compliance within five years. As a means of encouraging further safety enhancements, a “Subway Fire Prevention Facility Improvement Program” was launched last year to provide subsidies on installation of escape routes and smoke ventilation systems, which entails large-scale construction work.
2-2 Measures to prevent level crossing accidents
Based on the Law for Promotion of Level Crossing Improvement and the Seventh Comprehensive Level Crossing Accident Prevention Initiative, projects were implemented to replace level crossings with overpasses or underpasses, carry out structural improvements, and install new safety equipment.
As of the end of FY2003, 2,255 sites requiring overpass/underpass construction, 3,988 sites requiring structural improvement, and 27,664 sites requiring new safety equipment were designated for improvement under the above law, and work was continued to accomplish these improvements.
At the same time, efforts were continued to combine and eliminate certain crossings. As of the end of FY2003, the nationwide total number of level crossings had been reduced to 35,895.
Focus
Joetsu Shinkansen Derailment
During the Mid Niigata Prefecture Earthquake of 2004 at around 5:56 p.m. on October 23, the Joetsu Shinkansen Line's Toki 325 derailed between Urasa Station and Nagaoka Station as it was traveling to Niigata Station from Tokyo Station. The 10-car bullet train was carrying 154 passengers and crew, but no one was injured.
The Aircraft and Railway Accidents Investigation Commission is continuing to scrutinize the accident to pinpoint all the factors behind it. As the earthquake-triggered derailment of a train traveling at around 200 km/h and carrying so many passengers represented an unprecedented event in Japan's rail history, the commission determined that it was necessary to immediately examine measures for reducing damage during derailments caused by earthquakes, and thus it publicly released on January 24, 2005 a report on the progress of its investigation.
MLIT established the Conference on Shinkansen Derailment Countermeasures, comprising representatives from all Japan Railway operators of bullet train lines, to study measures for preventing derailments, lessening damage, enhancing the earthquake resistance of railway structures, and making other safety improvements. On March 30, the conference members compiled an interim report that called for the following implementations.
- Stronger earthquake resistance for mountain tunnels that cross active faults and for elevated bridge supports.
- Additional installation of earthquake detection/warning systems along tracks and upgrading of existing systems to prevent derailments.
- Study and planning of measures for preventing trains from significantly separating from the rails when derailment occurs, through improvements to both trains and facilities.
- Research on ways to prevent damage to rail fasteners and joints, design and install anti-derailment guards, reduce emergency brake stopping distance, and enhance the earthquake early warning system.
The conference has also determined that it is critical for safety measures that can be implemented now, such as acceleration of elevated bridge reinforcement projects, to be promptly put into action. Based on its interim findings, the conference is continuing to pursue necessary measures and additional investigation.
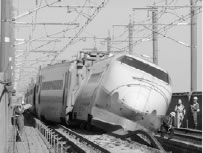
Toki 325 derailment
CHAPTER 2 MARITIME TRANSPORT
1 Maritime Accident Trends
1-1 Maritime accidents and rescues in 2004
A total of 2,883 vessels were involved in maritime accidents, with 979 of them returning to port without assistance. Of the remaining 1,904 vessels, 1,545 were rescued. A total of 13,973 people were on board the vessels involved in accidents. The vessels that required no assistance carried 8,438, while 5,361 of the remaining 5,535 were rescued.
There were 174 people who died or became missing in maritime accidents, and 143 people who died or became missing from falling overboard.
Changes in Vessels, Fatalities and Missing People in Maritime Accidents
Notes: 1. |
Source: Japan Coast Guard |
|---|---|
2. |
Figures for fatalities and missing people include those who, due to illness or other reasons, became unable to operate the vessel and died as it drifted. |
1-2 Major constituents of 2004 maritime accidents
The growth of marine leisure activity in recent years has been accompanied by a rise in maritime accidents involving pleasure boats and guided recreational fishing boats. The number of such vessels involved in maritime accidents rose by 75 over the preceding year to 1,126, accounting for 39% of all vessels in maritime accidents.
Commercial fishing vessel accidents were responsible for the largest number of fatalities and missing people resulting from maritime accidents (44% of total) and from falling overboard (69% of total).
2 Major Maritime Traffic Safety Measures in FY2004
2-1 Maritime environment enhancements
In accordance with the Priority Plan for Social Infrastructure Development, projects were carried out to develop ports, harbors, and waterways designated to be developed and preserved, and to enhance the earthquake resistance of ports and harbors. Under the Long-term Development Plan for Fisheries Infrastructure (FY2002-2006), improvements were made to fishing port and area facilities to promote greater safety for fishing vessels.
In order to improve the safety and traffic efficiency of congested waters, the government established the Maritime Traffic Information Systems to provide maritime traffic information and control shipping, and it operates Traffic Advisory Service Centers. On July 1, 2004, the Tokyo Wan Traffic Advisory Service Center began operating an advanced, AIS (Automatic Identification System)-based navigation support system to further enhance its information services for transiting vessels.
2-2 Maritime safety campaigns
A review of 2003 maritime accidents revealed that nearly 70% involved pleasure boats or commercial fishing vessels, and approximately 70% were the result of human error, including failure to adequately perform watchkeeping. In response to this situation, in 2004 the government engaged in maritime accident prevention activities (accident prevention seminars, etc.) tailored to recent accident trends and the characteristics of each type of vessel.
The government's “FY2004 National Emphasis Campaign for Prevention of Maritime Accidents” included two important focuses. One was aimed at promoting the wearing of life jackets to realize greater safety in vessels navigated by a single person, and the other sought to ensure dependable means of communication, such as by encouraging ship crews to constantly monitor international VHF radio channels.
2-3 Promotion of vessel safety
The prescriptions of the International Convention for the Safety of Life at Sea (SOLAS) are constantly reviewed and updated to incorporate advances in technology related to ship safety. The government revised domestic laws with regard to such changes, including the requirement for ships to maintain logs. In addition, domestic regulations were rewritten to reflect the International Load Line Convention's stricter bow protection requirements.
Driven by growing public awareness concerning the important role played by Port State Control (PSC) since May 2003, the government continued to enhance the PSC system, bolster coordination with other authorities, and focus PSC on vessels of registries with frequent incidence of defects.
2-4 Enhancement of other safety measures
In order to respond to the needs of boat users, and to streamline the system of regulations while maintaining navigational safety, the government partially revised “Regulations for the Enforcement of the Law for Ships' Officers and Boats' Operators” in October 2004. Accordingly, the government informed users about the changes, which included elimination of the Under 5-ton License, and made efforts to ensure proper implementation of the new system.
CHAPTER 3 AIR TRANSPORT
1 Air Traffic Accident Trends
The annual number of civil aircraft accidents in Japan has remained mostly level in recent years, showing only slight fluctuations. A total of 28 accidents occurred in 2004, resulting in 14 fatalities and 23 injuries.
| Aircraft type | Number of accidents | Number of casualties | ||||||||
|---|---|---|---|---|---|---|---|---|---|---|
| Year | Large aircraft | Small aircraft | Ultra-light aircraft | Heli-copters | Gyro-planes | Gliders | Airships | Total | Fatalities | Injuries |
| 2000 | 3 | 5 | 5 | 11 | 1 | 5 | 0 | 30 | 9 | 28 |
| 2001 | 2 | 6 | 2 | 7 | 0 | 4 | 0 | 21 | 12 | 131 |
| 2002 | 4 | 4 | 5 | 15 | 0 | 7 | 0 | 35 | 13 | 65 |
| 2003 | 3 | 10 | 3 | 1 | 0 | 2 | 0 | 19 | 12 | 13 |
| 2004 | 5 | 11 | 2 | 6 | 1 | 3 | 0 | 28 | 14 | 23 |
Source: |
Ministry of Land, Infrastructure and Transport | |
|---|---|---|
Notes: |
1. | All figures are as of the end of the given year. |
| 2. | Figures include accidents involving Japanese aircraft outside Japan (2 in 2000, 1 in 2003, 2 in 2004), and accidents involving foreign aircraft in Japan (1 in 2003). | |
| 3. | Figures do not include natural deaths or non-accidental casualties (self-inflicted or otherwise) that occurred on board aircraft. | |
| 4. | Fatalities include all deaths occurring within 30 days and missing people. | |
| 5. | Injury figures for 2004 are provisional. | |
Postscript: Beginning in January, a string of non-fatal but serious safety problems have occurred in 2005. The details are as follows.
1. JAL Group safety problems: Several incidents involving airplanes operated by Japan Airlines International Co. Ltd. have occurred. In one case, it was discovered that incorrect main landing gear components had been used in the company's B747 cargo jets for years. On March 11, a Japan Airlines International pilot misinterpreted the air traffic controller's instructions at Incheon International Airport in South Korea, and on March 14 flight attendants failed to make emergency slides automatically operable on one flight.
In addition, a Japan Airlines Domestic Co., Ltd. pilot violated takeoff procedures at New Chitose Airport on January 22.
Since the safety problems occurred within a short span of time and the companies involved failed to adequately communicate information and take appropriate responses, the Ministry of Land, Infrastructure and Transport (MLIT) took action to prevent similar incidents from happening and to ensure transportation safety. On March 17, MLIT issued an operations improvement order to Japan Airlines International, directing the company to thoroughly determine the causes of the problems, carry out complete safety inspections on its operations, review its safety system, and reinforce employees' consciousness on safety. MLIT also sent a warning to Japan Airlines Domestic that called for similar safety improvements, and a warning to Japan Airlines Corporation (the holding company for Japan Airlines International and Japan Airlines Domestic) that requested it to provide better guidance and supervision of the companies under its control.
On April 14, the JAL Group provided MLIT with an operational improvement report that described the common factors and background behind the aforementioned incidents, and the new preventive measures that it adopted. The report also included information related to other safety problems that occurred after MLIT issued the improvement order.
In order to verify that the operational improvements were being implemented, MLIT carried out on-site inspections of JAL's head office, headquarters for operation, maintenance, and passenger cabin operation from April 20 to 22. The ministry also made on-site inspections at JAL's major operating centers in Chitose, Itami, Fukuoka, and other domestic locations in May, and plans to conduct additional JAL inspections every two to three months until the end of 2005 to monitor the progress of the new safety measures and provide guidance on them.
2. Tokyo International Airport ATC incident: At approximately 9:39 p.m. on April 29, 2005, the airport air traffic control cleared an arriving aircraft to Tokyo International Airport from Obihiro Airport to land on runway “A,” though information on the closure of the runway had been disseminated. A succeeding arrival from New Chitose Airport was also directed to the same closed runway, but air traffic controllers realized that the runway “A” had been closed, and guided the second aircraft to a different runway.
This incident resulted from inadequate information briefing on the runway closure to controllers, which led to memory slips among all controllers on duty. All controllers involved underwent a recurrent course immediately after the incident.
MLIT ordered all ATC facilities nationwide to develop operational manuals clarifying procedures and responsibilities for collection, dissemination, and cross-checking of aeronautical information for the purpose of preventing recurrences. The ministry is also undertaking additional safety measures, including development of a system to process essential information, such as operational restrictions of runways.
2 Major Air Traffic Safety Measure in FY2004
The government has implemented various measures at airports and air traffic services facilities in order to cope with the increasing demand and diversifying needs of air transport and to maintain aviation safety.
Along with the opening of Chubu Centrair Airport (February 2005), the government established a new approach control area, reorganized the surrounding airspace, and restructured some airways.
Focus
Emergency Implementation of Nationwide Transport Safety Inspections
From January to March of 2005, a series of serious safety problems and accidents attributable to human error occurred in the railway and air transportation industries, including a fatal accident at a manually operated crossing at Takenotsuka Station on Tobu Railway's Isezaki Line, and a violation of air traffic control procedures by a Japan Airlines Domestic pilot at New Chitose Airport. On March 24, the Minister of Land, Infrastructure and Transport responded to this alarming situation by sending notices to railway operators, air carriers, and air traffic control agencies across the nation to request them to carry out full safety inspections.
The inspections, which were for the most part conducted autonomously by each operator, were focused on the following concerns.
- Field operations directly related to safety: The degree to which manuals appropriately reflect actual transport operations, how thoroughly information is communicated in the field, etc.
- Corporate systems for ensuring safety: The state of internal rules for checking up on field problem reports, what systems are in place to study measures for preventing recurrence of mishaps, etc.
Due to the large number of problems that occurred in the air transport industry, MLIT carried out its own inspections of air carriers to check the progress of their safety inspections.
MLIT has also requested the transport service operators to submit reports after the inspections end, and plans to provide guidance to operators where needed.
On April 25, as the inspections were under way, a disastrous derailment occurred on JR West's Fukuchiyama Line, resulting in 107 deaths and 460 injuries. As this happened just before the Golden Week holidays, a period of heavy travel, the Minister of Land, Infrastructure and Transport again sent notices to operators of public land, maritime, and air transport services, strongly urging them to ensure the safety of their services. On May 2 and 6, the minister visited five railway companies, two airlines, and two air traffic control facilities to personally examine the state of their safety inspections.
In response to the air traffic control incident that occurred on April 29 at Tokyo International Airport, MLIT ordered the ATC facility to immediately develop a plan for preventing recurrence of similar incidents.
PART II
TRAFFIC SAFETY MEASURES FOR IMPLEMENTATION
IN FY2005
CHAPTER 1 LAND TRANSPORT SAFETY
Section 1 Road Transport Safety
Road Environment Enhancements
With the cooperation of prefectural public safety commissions and road management agencies, the national government will actively promote enhancement of traffic safety facilities and other elements of the road environment during FY2005 in accordance with the aims of the Priority Plan for Social Infrastructure Development.
Focused implementation of traffic safety measures
Since traffic accidents on arterial roads are concentrated in certain sections, the government will seek to more effectively and efficiently reduce such accidents through a focused approach. To do so, the government will start using a “Priority Identification Process”1 in FY2005 to pinpoint not only hazardous points, but also road sections with a high incidence of casualty-inflicting accidents so that safety measures can be concentrated on those areas.
In addition, the government will pursue safety improvement efforts based on scientific analysis by formulating and implementing individual measures with reference to the “Traffic Accident Countermeasures and Assessment Manual”2 and the “Casebook of Traffic Accident Countermeasures.”3
Promotion of black spot remedies
With the assistance of prefectural public safety commissions and road management agencies, the government will continue to apply focused accident prevention measures to “black spot” intersections and road sections that have a high incidence of casualty-inflicting accidents.
Development of “Safe Pedestrian Areas”
The “Safe Pedestrian Area” program will continue to implement wide-area, comprehensive accident prevention measures in designated residential and commercial districts (bordered by major roads) with high traffic accident casualty rates, based on collaboration with prefectural public safety commissions and road management agencies.
1 This is a formula for arranging road sections in order of their casualty-inflicting accident rates to identify the sections to which priority should be given for safety improvement projects.
2 This manual is a systematic compilation of procedures, points of consideration, and other matters related to the entire process of traffic safety measure implementation, from proposal to assessment. It is based on the results of accident countermeasures previously implemented under the Black Spot Emergency Measures Program and other projects.
3 This is a compilation of accident countermeasures and the results of analysis of the causes of accidents at 557 accident-prone sites. It analyzes the accident causes and the measures implemented against them according to the road characteristics and various accident categories.
Barrier-free development of safe walkways
In order to ensure the safety and convenience of pedestrians and bicycle riders, the government will promote focused projects for the enhancement of existing sidewalks and the creation of new walkways and bike paths in areas with frequent pedestrian and bicyclist accidents.
In addition, steps will be taken to help seniors and disabled people lead independent, socially active lives by developing broad, level walkways and installing barrier-free signals in areas around train stations, welfare centers, hospitals and other public facilities, implementing reconstruction projects, and eliminating utility poles. Other projects include the conversion of traffic signals to LED systems, and efforts to enhance the visibility of road signs and markers, such as by redesigning signs to be larger, brighter, and adjustable.
2 Implementation of the Road Traffic Safety Initiative
Traffic safety education for seniors
The “Citizen-involved Project to Promote Traffic Safety Education for Seniors” will be implemented to train Silver Leaders as promoters of sustained safety education for seniors with an orientation toward involvement, hands-on experience, and personal practice. Also, the “Central Silver Leader Training Program” will be implemented to improve Silver Leaders' skills in nurturing sub-leaders. In addition, efforts will be made to further expand the “Traffic Safety Awareness Program for Seniors,” which includes the “Cross-generation Sharing Project,” in which people of all generations gather to discuss traffic safety, and the “Senior Home Visit Project,” which offers traffic safety guidance to seniors unable to attend safety seminars.
3 Promotion of Safe Driving
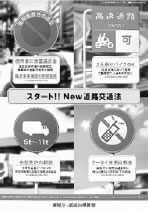
Motorcycle-related safety measures
As of April 1, 2005, two-wheeled motorized vehicles carrying two persons are now permitted to travel on expressways. The government will seek to ensure safety regarding this change by promoting smooth, effective education for motorcycle license applicants, and offering a new course for motorcycle operators when they renew their licenses. In addition, the government will support the hosting of safe motorcycle operation courses, and the provision of practical, effective education for motorcycle operators at designated driver's education schools.
4 Improvement of Vehicle Safety
Improvement of vehicle recall systems
In order to prevent the recurrence of illegitimate practices regarding vehicle defects, the government will work to make the recall system function more quickly and effectively, and will bolster its supervision of automakers to ensure vehicle safety. This effort includes requiring manufacturers to regularly submit reports, enhancing publicity for users and other aspects of the information gathering system, reinforcing the audit system (including improvement of intensive audits of suspect manufacturers and dealer audits), and strengthening the technical inspection system for checking and testing suspect vehicles.
5 Enhancement of Rescue Systems
Rescue service enhancements
The government will encourage the holding of first aid seminars for community residents and businesses. Since the right to use automatic external defibrillators (AED) was extended to nonmedical professionals in July 2004, the government will have fire and rescue agencies include AED operation as one of the subjects offered in their lifesaving courses.
6 Improvement of Liability Security and Victim Support
Enhancement of public traffic accident consultation services
The “Traffic Accident Counselor Support Program” launched in FY2004 will be further enhanced. The government will support the development of a system to provide traffic accident counselors with direct access to advice and guidance from advisors, including attorneys, so that they can quickly and accurately respond to the increasingly complex and diversified consultation cases they receive.
Section 2 Railway Transport Safety
1 Railway Environment Enhancements
In order to ensure the safety of railway transport services, the government will promote the installation of equipment to prevent damage to railroad facilities by landslides, falling rocks, and other natural hazards, as well as the installation of equipment and structures for eliminating mobility barriers at train stations and other facilities. As a measure for preserving safe travel on smaller regional lines, the government will provide guidance to the railway operators with regard to proper maintenance and repair of facilities and trains.
Efforts will be continued to ensure the earthquake resistance of railway structures through guidance to railway companies on suitable measures for reinforcing earthquake resistance. With regard to subway stations that are not compliant with fire safety codes, the government will continue to encourage subway operators implement the improvements necessary for bringing the stations into compliance.
2 Measures to Prevent Level Crossing Accidents
In accordance with the Law for Promotion of Level Crossing Improvement and the Seventh Comprehensive Level Crossing Accident Prevention Initiative, projects will be actively implemented to replace level crossings with overpasses or underpasses, make structural enhancements, install safety equipment, combine and eliminate certain crossings, and make other improvements to prevent level crossing accidents and facilitate traffic flow.
CHAPTER 2 MARITIME TRANSPORT SAFETY
1 Safety Facility Enhancements
In accordance with the Priority Plan for Social Infrastructure Development, projects will be carried out to develop breakwaters, waterways, anchorages, and other infrastructure, create emergency refuge harbors for small vessel operating in coastal waters, reinforce the earthquake resistance of ports and harbors, and make other improvements.
Under the Long-term Development Plan for Fisheries Infrastructure, fishing port and area facilities will be enhanced to realize greater safety for fishing vessels.
2 Improvement of Traffic Information and Control
The government will continue operating the Maritime Traffic Information Systems, which provide maritime traffic information and control shipping with the aim of ensuring the safe navigation of vessels in Tokyo Wan, Seto Inland Sea, and other congested areas. The government will also continue to promote the development of a maritime highway network by examining ways to create a new traffic system in Ise Wan and deploying in Nagoya Ko and Seto Inland Sea next-generation navigational support systems that use Automatic Identification Systems (AIS).
3 Propagation of Maritime Safety Information
As a means of enhancing the impact of publications that introduce detailed analysis of the state and causes of maritime accidents, rulings on such accidents, and preventive measures, the government will conduct maritime safety seminars and other publicity/education activities that utilize the information provided in these publications.
4 Promotion of Vessel Safety
In accordance with the “International Convention on Standards of Training Certification and Watchkeeping for Seafarers, 1978” (STCW) and the “Convention for the Safety of Life at Sea” (SOLAS), the government will continue to promote proper Port State Control (PSC) with regard to foreign crew licenses, watchkeeping systems, and operational requirements (whether crew is fully capable of operating ship systems).
CHAPTER 3 AIR TRANSPORT SAFETY
Air Traffic Safety Facility Enhancements
In response to the ever increasing demand and diversifying needs of air transport, the government has developed plans to implement next-generation air traffic services, including Multi-functional Transport Satellite (MTSAT), with the aim of enhancing airspace capacity while maintaining aviation safety as the paramount goal. Implementation of current air navigation systems, such as instrument landing systems (ILS) and airport lighting systems, etc., has also been undertaken along with the development of new airports.