WHITE PAPER ON TRAFFIC SAFETY IN JAPAN 2006
- Japanese
- English
Abridged Edition
CABINET OFFICE
Editorial Supervision:
Directorate General for Policies on Cohesive Society, Cabinet Office
This English version of White Paper on Traffic Safety in Japan (Abridged Edition) was compiled under the supervision of Directorate General for Policies on Cohesive Society, Cabinet Office.
The International Association of Traffic and Safety Sciences hopes this paper, in conjunction with Statistics of Road Accidents Japan (Abridged Edition), will greatly enhance readers' knowledge of traffic accident remedial measures.
White Paper on Traffic Safety in Japan 2006
Cabinet Office
Under Article 13 of the Traffic Safety Policies Law (Law No. 110 of 1970), the government is required each year to report to the Diet on the status of traffic accidents in the previous year, on measures currently being implemented to promote traffic safety, and on plans for traffic safety measures in the current year. All of this is contained in a report known as the White Paper on Traffic Safety.
This year's White Paper is the 36th in the series of such reports. Part I and Part II of the report follow the structure of the Seventh Fundamental Traffic Safety Program and the Eighth Fundamental Traffic Safety Program respectively, and each is organized into sections on land (road and railway), maritime and air transportation.
- IATSS
-
6-20, Yaesu 2-chome, Chuo-ku, Tokyo 104-0028, Japan
Tel: +81-3-3273-7884
Fax: +81-3-3272-7054
E-mail: mail@iatss.or.jp
URL: http://www.iatss.or.jp
Copyright © by International Association of Traffic and Safety Sciences
October 2006
Printed in Japan
CONTENTS
- PART I
TRAFFIC ACCIDENTS AND SAFETY MEASURES IN FY2005- CHAPTER 1 Land Transport
- Section 1 Road Transport
- 1 Road Traffic Accident Trends
- 2 Overview of Current Policies on Road Traffic Safety
- 2-1 Improvement of road traffic environment
- Focus Sidewalk Development:Providing People-First Walking Spaces that Offer Safety and Bestow Peace of Mind
- 2-2 Dissemination and reinforcement of traffic safety messages
- Focus Reflective Material and Traffic Safety
- 2-3 Enforcing safe driving practices
- 2-4 Advancing vehicle safety
- 2-5 Improving rescue and emergency services systems
- Section 2 Railway Transport
- 1 Trends in Railway Accidents
- 2 Railway Traffic Safety Measures
- 2-1 Improving the railway traffic environment
- 2-2 Assuring the safe operations of railways
- Focus Accident Investigation and Safety Measures Relating to the Derailment Accident on the JR West Fukuchiyama Line
- Focus Expediting Measures to Eliminate Grade-Level Crossings
- Focus Comprehensive Safety Measures for Public Transportation
- Section 1 Road Transport
- CHAPTER 2 Maritime Transport
- CHAPTER 3 Air Transport
- CHAPTER 1 Land Transport
- PART II
TRAFFIC SAFETY MEASURES FOR IMPLEMENTATION IN FY2006
Note: |
Since the figures in the graphs and tables were rounded to the nearest unit, the totals expressed may slightly differ from the sum of constituent figures. |
|---|
PART I
TRAFFIC ACCIDENTS AND SAFETY MEASURES IN FY2005
CHAPTER 1 LAND TRANSPORT
Section 1 Road Transport
1 Road Traffic Accident Trends
1-1 Long-term trends
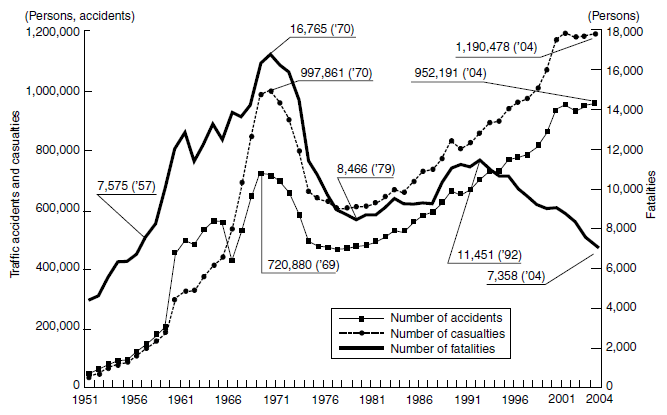
- (1) The annual number of fatalities from road traffic accidents in Japan peaked at 16,765 in 1970.
- (2) In the same year, the Diet enacted the Traffic Safety Policies Law. In accordance with this law, expert panels have developed plans known as Fundamental Traffic Safety Programs every five years since FY1971. These programs have provided the framework for comprehensive and systematic measures aimed at improving traffic safety.
- (3) Beginning in 1971 traffic fatalities began to decline and continued a steady downward trend until reaching 8,466 in 1979. Thereafter, however, fatalities turned upward again and continued to rise until 1992, when a new downward trend began.
- (4) In 2005, traffic fatalities decreased to 6,871, the first time in 49 years (since 1956) that the death toll fell below 7,000. Moreover, accidents and casualties declined to 933,828 and 1,163,504, respectively, marking the first year-on-year decrease in three years.
Changes in Road Traffic Accidents, Casualties and Fatalities
Notes: |
1. | Source: National Police Agency |
|---|---|---|
| 2. | Figures after 1966 do not include property-damage-only accidents. | |
| 3. | Figures for Okinawa Prefecture were not included before 1972. |
1-2 Road traffic accidents in 2005
| Number of accidents: | 933,828 (-18,363, -1.9%) |
|---|---|
| Casualties (fatalities + injuries): | 1,163,504 persons (-26,974, -2.3%) |
| Injuries: | 1,156,633 persons (-26,487, -2.2%) |
| Fatalities (within 24 hours of the accident): | 6,871 persons (-487, -6.6%) |
| Fatalities (within 30 days of the accident): | 7,931 persons (-561, -6.6%) |
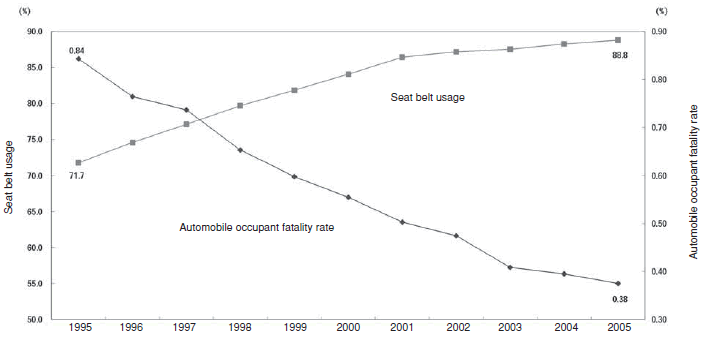
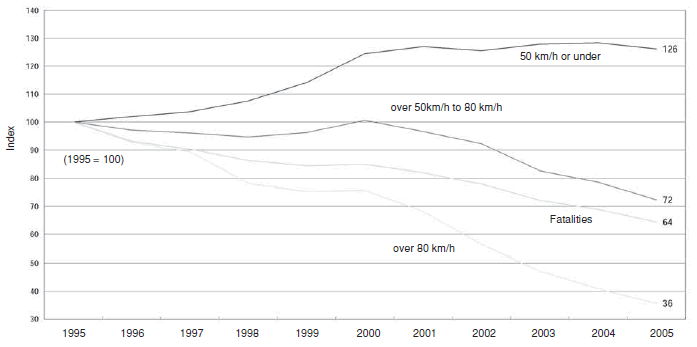
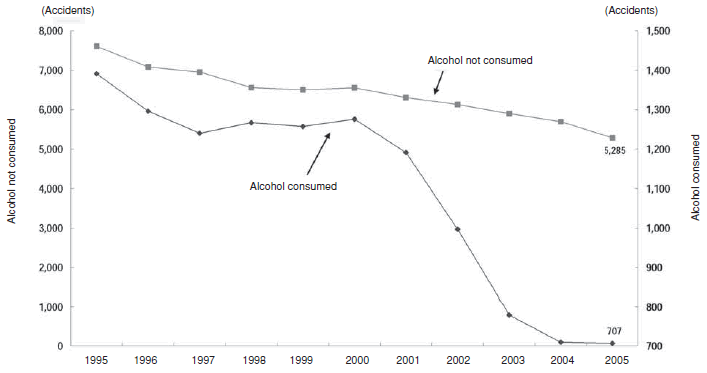
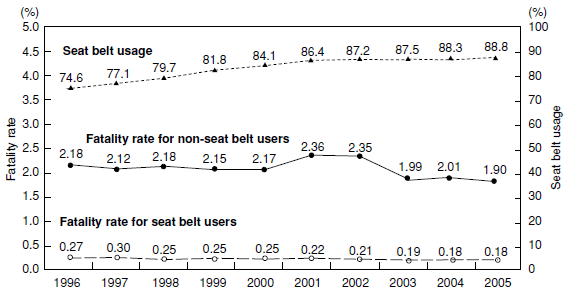
The decline in fatalities in recent years can be attributed largely to efforts to carry out a comprehensive set of measures based on the Fundamental Traffic Safety Programs, including measures aimed at improving the road traffic environment, at disseminating and reinforcing messages on traffic safety, and at ensuring safe driving practices, and, in addition, measures aimed at advancing vehicle safety, preserving order on roads, and improving rescue and emergency medical systems. Certain quantitatively measurable improvements also contributed to this decline, including (1) increased seat belt usage, (2) lower pre-accident speeds, and (3) the effects of the Initiative for Stricter Drunk Driving Penalties and Other Measures against Dangerous Driving.
Seat Belt Usage and Automobile Occupant Fatality Rate
Notes: |
1. | Source: National Police Agency |
|---|---|---|
| 2. | Seat belt usage = seat belt-wearing automobile occupant casualties ÷ total automobile occupant casualties × 100 | |
| 3. | Automobile occupant fatality rate = automobile occupant fatalities ÷ automobile occupant casualties × 100 |
Number of Traffic Accidents (by Hazard Recognition Speed) and Fatalities
Notes: |
1. | Source: National Police Agency |
|---|---|---|
| 2. | “Hazard recognition speed” refers to the speed at which an automobile or moped is traveling when the driver notices the hazard (moving or parked vehicle, pedestrian, safety barrier, utility pole or other obstacles, etc.). |
Number of Fatal Road Accidents, by Alcohol Consumption
Note: |
Source: National Police Agency |
|---|
Casualties: By age group
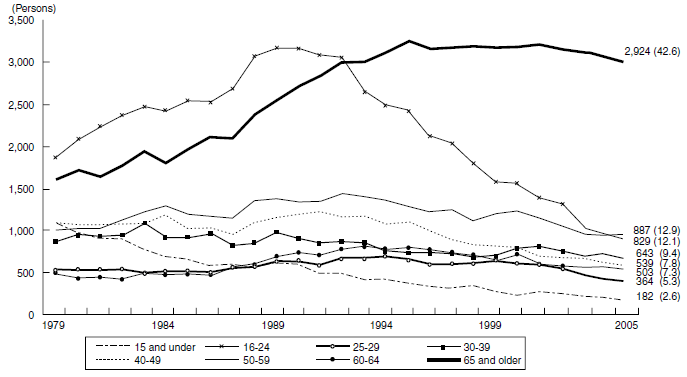
- (1) For the 13th consecutive year, people aged 65 and over accounted for the largest number of road fatalities. This number (2,924) represented more than 40% of those killed in traffic accidents. On the other hand, deaths in all age groups declined compared to the previous year.
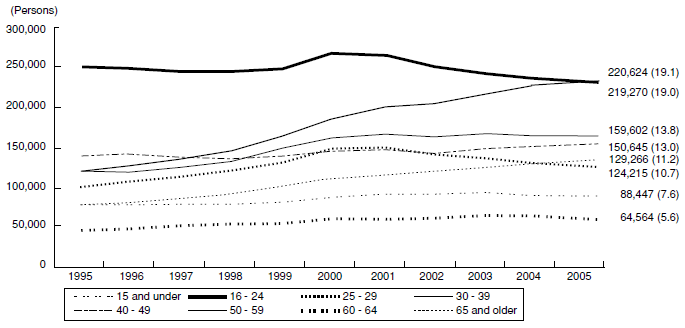
- (2) Injuries were the highest among 30-39 year-olds (220,624) and 16-24 year-olds (219,270). On a year-to-year basis, notable declines were seen in the 16-24 year-old category (11,236 less than the previous year) and in the 25-29 year-old category (7,356 less). Injuries increased among 40-49 year-olds (by 1,593).
Changes in Traffic Accident Fatalities, by Age Group
Notes: |
1. | Source: National Police Agency |
|---|---|---|
| 2. | Figures in parentheses show percentage (%) of fatalities by age group. |
Changes in Traffic Accident Injuries, by Age Group
Notes: |
1. | Source: National Police Agency |
|---|---|---|
| 2. | Figures in parentheses show percentage (%) of injuries by age group. |
Casualties: By mode of transportation
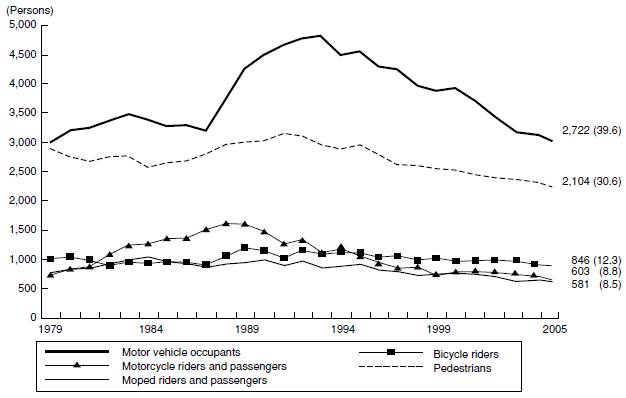
- (1) Fatalities occurred most frequently among those riding in automobiles. Deaths in this category numbered 2,722 and accounted for 39.6% of all traffic fatalities. However this was a marked decline compared to the previous year.
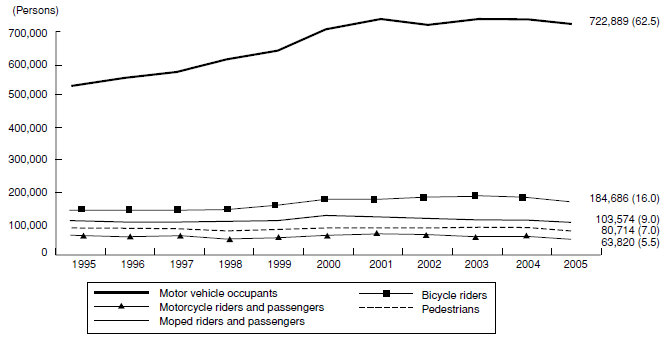
- (2) Most injuries from traffic accidents were suffered by those riding in automobiles. These numbered 722,889 and accounted for 62.5% of all persons injured in traffic accidents.
Changes in Traffic Accident Fatalities, by Mode of Transportation
Notes: |
1. | Source: National Police Agency (figures for “Other” omitted) |
|---|---|---|
| 2. | Figures in parentheses show percentage (%) of fatalities by mode of transportation. |
Changes in Traffic Accident Injuries, by Mode of Transportation
Notes: |
1. | Source: National Police Agency (figures for “Other” omitted) |
|---|---|---|
| 2. | Figures in parentheses show percentage (%) of injuries by mode of transportation. |
Fatalities: By seat belt usage
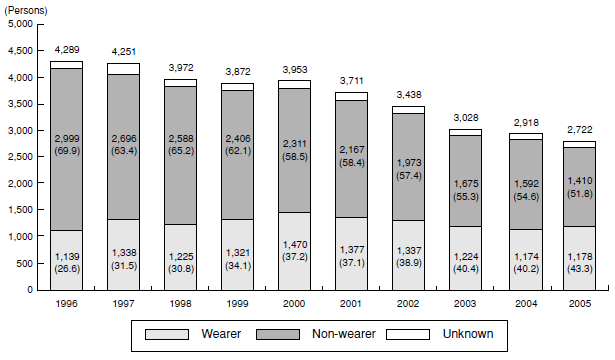
- (1) Deaths among occupants of automobiles who were not using seatbelts numbered 1,410, a decline of 182 persons (11.4%) compared to the previous year.
- (2) The fatality rate (ratio of fatalities to total casualties) for seatbelt wearers was approximately one-tenth that of non-wearers.
Changes in Automobile Occupant Fatalities, by Seat Belt Usage
Notes: |
1. | Source: National Policy Agency |
|---|---|---|
| 2. | Figures in parentheses show percentage (%) of fatalities by seat belt usage. |
Changes in Automobile Occupant Fatality Rates, by Seat Belt Usage;
Usage of Seat Belts by Automobile Occupant Casualties
Notes: |
1. | Source: National Police Agency |
|---|---|---|
| 2. | Ratio of seatbelt usage: Number of persons injured or killed (in cars) while wearing seatbelts ÷ number of persons injured or killed (in cars) × 100. Fatality rate for seatbelt users: Number of persons killed (in cars) while wearing seatbelts ÷ number of persons injured or killed (in cars) while wearing seatbelts × 100. Fatality rate for non-seatbelt users: Number of persons killed (in cars) while not wearing seatbelts ÷ number of persons injured or killed (in cars) while not wearing seatbelts × 100. |
Child fatalities and child safety seat usage
A total of 21 children under age six were killed, and 174 seriously injured, while riding in automobiles. The fatality rate among children who were not restrained in child safety seats was approximately 3.1 times higher than that of those who were restrained. The fatality rate among children who were not restrained in child safety seats was approximately 3.1 times higher than that of those who were restrained.
Fatal accidents caused by primary party
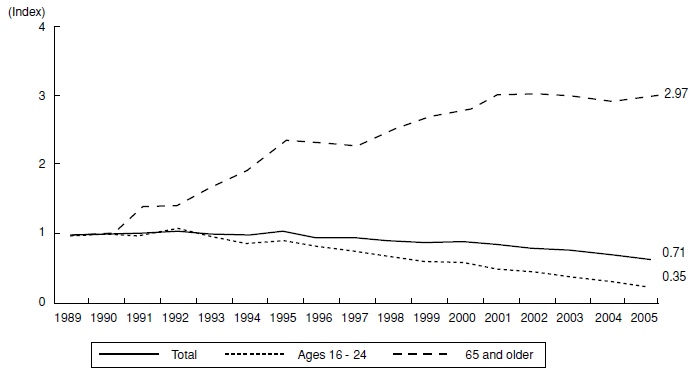
The number of fatal accidents in which automobile drivers aged 65 and older were the primary party1 continued to increase. In 2005, this number was approximately 3 times higher than the level in 1989.
1 The party most to blame for the accident, or, when the parties involved share nearly equal fault, the party that suffered the least harm.
Changes in Fatal Accidents Caused by Primary-party Automobile Drivers (Young and Elderly)
Notes: |
1. | Source: National Police Agency |
|---|---|---|
| 2. | Index figures are based on 1989 (= 1). |
Focus
The Eighth Fundamental Traffic Safety Program
Transportation safety policy in Japan has been based on seven consecutive five-year plans known as Fundamental Traffic Safety Programs, which have been drawn up since FY1971. The measures executed in accordance with these plans have aimed to enhance transportation safety in the areas of land, maritime and air transportation. On March 14, 2006, the Central Committee on Traffic Safety Measures adopted the Eighth Fundamental Traffic Safety Program, which established the framework for measures to be executed over the five-year period from FY2006 to FY2010.
In this section, we explain the process by which the new program was adopted and the structure of the plan. We also provide an overview of the program's basic philosophy.
The content of the respective sectors is noted at the beginning of each chapter (section) of the report: land transport (page 15); railway transport (page 41); maritime transport (page 51); and air transport (page 60).
Our Focus sections, entitled “Expediting Measures to Eliminate Grade-Level Crossings” (page 46) and “Comprehensive Safety Measures for Public Transportation” (page 48), include excerpts from the Eighth FTSP.
What is the Fundamental Traffic Safety Program?
The Fundamental Traffic Safety Program establishes the broad outlines for comprehensive and long-term policies on transportation safety in land, maritime, and air transportation. In accordance with the Traffic Safety Policies Act (Act No. 110, 1970), the Central Committee on Traffic Safety Measures (chaired by the Prime Minister, and whose committee members consist of the 13 members of the Cabinet) is charged with preparing the plan.
In accordance with this fundamental program, each year related national agencies prepare and execute plans that provide for measures to be adopted during that fiscal year. In addition, based on the Fundamental Traffic Safety Program, local public authorities prepare and execute long-term and annual plans in their respective jurisdictions.
1 Process of adoption
In February 2005, an expert panel serving under the Central Committee on Traffic Safety Measures (consisting of 20 experts in engineering, education, psychology etc. and chaired by Shigeru Morichi, Professor, National Graduate Institute for Policy Studies) began a year-long examination of the issues to be dealt with under the Eighth Fundamental Traffic Safety Program. In September 2005, the panel announced an “Interim Working Draft of the Eighth Fundamental Traffic Safety Program” and called for public comment. In an effort to incorporate voices from as wide a spectrum of the nation as possible, the panel held a public hearing on October 13, where it received testimony directly from interested parties. The central committee then convened a meeting on March 14, 2006, where it formally adopted the plan.

The Prime Minister and other Cabinet members at the March 14, 2006 meeting of the Central Committee on Traffic Safety Measures
2 Components of the plan
The Eighth Fundamental Traffic Safety Program begins by stating the common philosophy that underlies the measures that have been adopted for all sectors of transportation: land, maritime, and air. It then goes on to discuss the “basic thinking,” “objectives” and “measures (perspectives, and the policies to be enacted)” adopted for each sector: (1) road transport; (2) railway transport; (3) traffic on roads with grade crossings; (4) maritime transport; and (5) air transport.
Most notably, the Eighth FTSP clearly sets forth objectives for each sector and establishes numerical objectives that will be targeted during the period of the plan.
3 Basic philosophy of the Eighth FTSP
In the Eighth Fundamental Traffic Safety Program, a common philosophy is spelled out for all transportation sectors (land, maritime and air); it can be summarized as follows:
- (1) The aim is an accident-free society
- To build a society that is truly affluent and energetic, the safety and peace of mind of the nation's people are essential. Endeavoring to provide safety in transportation is an important element in this equation.
- Based on a respect for human life, the nation should ultimately aim for the complete elimination of traffic accidents from society. This is especially true when one considers the enormous social and economic losses that are caused by traffic accidents.
- (2) Giving people precedence
- In a civilized society, consideration and sympathy must exist for those who are weaker than others.
- On roads, for example, pedestrians are in a weak position compared to those in automobiles; with respect to all modes of transportation, there is a need to assure greater safety for people who are the most prone to traffic accidents, such as the elderly, the disabled, and children.
- All policies should be carried out in accordance with this “people first” philosophy of traffic safety.
- (3) Basic thinking governing the execution of traffic safety measures
- Traffic safety agencies will vigorously pursue their policies while taking into account the interactions among three important elements of transportation society, namely: {1} the people; {2} the means of transportation; i.e., vehicles, vessels, aircraft, or other; and {3} the transportation environment which is to say the spaces where people and means of transportation function.
- Particularly with respect to road traffic, it will be important to promote further “people first” policies, including improving sidewalks along school routes, residential roads, and major thoroughfares in urban districts.
- The program will encourage participatory and cooperative-type traffic safety activities, by creating mechanisms that enable citizens to participate in the planning stages of traffic-safety measures run by national and local authorities, by inviting them to take part in volunteer comprehensive safety evaluation programs, and by designing activities that adapt to the characteristics of each community.
- (4) Dealing with the issue of human error in public transportation
- In all public transportation sectors (land, maritime, and air), those in administrative organizations and those in companies that are providing the services must gain a renewed appreciation of the extreme urgency of assuring safety in their respective sectors. In addition to seriously reexamining all existing traffic safety measures and to reassessing their individual efforts to ensure transportation safety, these persons must investigate what lies behind human error and must develop more effective anti-accident measures from the perspective of improving the organizational structures and overall systems of the companies that are providing transportation services.
Focus
Future Directions in Road Traffic Safety Measures
- From the Eighth Fundamental Traffic Safety Program -
The Seventh Fundamental Traffic Safety Program, which was composed in FY2001 (and covered the period FY2001-FY2005), set as its target decreasing road traffic fatalities to less than 8,466. This goal was achieved in the second year of the program, in 2002. In 2003, therefore, the government established a new policy which sets out to “reduce the number of traffic fatalities to less than 5,000 within a 10-year period, and to create a record of road transportation safety that is second to none in the world.” The government dealt comprehensively with one area in particular, traffic safety measures for the elderly, who account for the largest percentage of fatalities. It based its efforts on a program adopted in March 2003 by the Task Force on Transportation which was called “On Comprehensive Traffic Safety Measures for the Elderly toward the Transition to the Full Scale of Aging Society.”
The number of traffic fatalities continued to decline in 2003, and in 2005 fell below 7,000 for the first time in nearly half a century. Nevertheless, there continue to be large numbers of people killed or injured in traffic accidents. On January 2, 2006, the head of the Task Force on Transportation released a statement indicating the government's continued strong commitment to pursuing comprehensive traffic safety policies.
Future road traffic safety policies will be pursued within the framework of the Eighth Fundamental Traffic Safety Program, which was adopted on March 14, 2006. The new program states the government's intention to redouble its efforts to reduce traffic fatalities, in order to achieve the goals that it set in 2003. It goes on to commit the government to an even more robust effort to reduce the number of accidents per se; and, for the first time since Fundamental Traffic Safety Programs were begun, it establishes numerical objectives for the reduction of traffic casualties. The following is an outline of the discussion on road traffic safety contained in the Eighth FTSP.
1 Basic thinking
- Based on a respect for human life, Japan will aim ultimately to eliminate all traffic accidents from society.
- Clearly, there is a need for further efforts to reduce the number of traffic fatalities, but in addition more robust measures must be adopted to reduce the number of accidents per se.
- Pedestrian deaths as a percentage of total traffic fatalities are higher in Japan than in the United States and Europe. In light of the plan's commitment to a “people first” philosophy in all measures dealing with traffic safety, it will be important for the country to take steps to assure pedestrian safety through improvements to sidewalks etc.
2 Objectives
- By 2012, to reduce traffic fatalities to less than 5,000 and to create a record of road transportation safety that is second to none in the world.
- By 2010, to reduce traffic fatalities to less than 5,500.
- By 2010, to reduce traffic casualties (total deaths and injuries) to less than 1 million.
3 Measures
(1) Perspectives
-
{1} Responding to declining birthrates and an aging society
The rate of traffic fatalities among elderly persons is extremely high in Japan compared to those in other countries, and the graying of society will continue rapidly to increase hereafter. In light of this situation, it is indispensable to establish a transportation society in which elderly persons will be able to go out and travel safely and with peace of mind.
To build such an environment, the government will have to pursue traffic safety measures that are both detailed and comprehensive, basing them on the widely varied realities that characterize today's elderly population. Differences in their modes of transportation must also be considered, so that, for example, distinctions can be made between the elderly who mainly walk or use bicycles and those who drive automobiles. Keeping these differences in mind, Japan must then develop measures that reflect an understanding of the differing characteristics of these two groups of people. This is important particularly with respect to the latter group, for it is widely expected that the number of elderly drivers will increase sharply hereafter. Clearly, devising stronger measures to prevent traffic accidents among the elderly is an urgent issue.
While dealing with the concerns of a progressively aging society, Japan must also consider the problem of declining birthrates. The task here is to create a society in which people feel no reservations about having children and about bringing them up safely. In addressing this issue, the nation must not only look for ways to make society safer in terms of crime prevention but also must devise traffic safety measures that seek ways to protect children from accidents.
In this regard, the country must push forward boldly on programs that provide better sidewalks and other walking spaces along school routes and other roads.

Traffic education for elderly drivers -
{2} Establishing improved pedestrian safety
In Japan, pedestrian fatalities account for over 30% of all traffic-related deaths, which is high in comparison to Europe and the United States. Most notably, the rate of pedestrian deaths to total traffic fatalities is around 50% for elderly persons and approximately 40% for children under 16 years old.
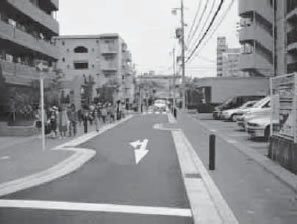
To create a society that is safe and bestows peace of mind on its citizens, there is no greater need than to protect pedestrians who are in a vulnerable position compared to those in automobiles. For elderly persons and children, this need is particularly acute in areas around neighborhood roads. Faced with these conditions, the country must adopt policies that meet these needs, including by taking greater initiative to provide safer spaces for walking. This will entail, among other things, improving sidewalks along school routes, residential roads, and major thoroughfares in urban districts.
Safe pedestrian spaces -
{3} Raising people's awareness
Every Japanese citizen who participates in the transportation society, including public officials who administer our transportation systems and those who provide transportation services, must become fully aware of the danger of traffic accidents. With the aim of building an accident-free society, each person must then remind him or herself of the need for vigilance against either causing a traffic accident or become involved in one.
Encouraging this kind of awareness will require that the nation enhance traffic safety education programs and organize more and better public-information and awareness-raising activities. However, unilateral measures will have only a limited impact. Instead of simply providing information and urging action, traffic safety agencies must succeed in encouraging large numbers of citizens to feel that they can build a safe and secure transportation society on their own accord.
Toward this end, the nation will need to establish mechanisms that enable citizens to take an active part in building a safe and secure transportation society. For example, through involvement in local communities or organizations, residents can gain an awareness of the issues facing their communities, can establish their own concrete objectives and policies, and can take part directly in various activities relating to traffic safety. Local governments have a role to play in this process, by helping to devise related mechanisms that are suitable to the circumstances in their communities.
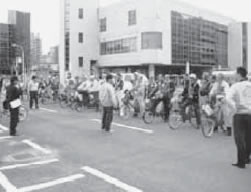
Traffic safety classes based on participation, experience and practice -
{4} Utilizing IT
The information society is moving ahead in leaps and bounds. In this environment, building a safe and secure transportation society will hinge significantly on the effective use of information. Information technology (IT) can make major contributions in certain areas, such as in supplementing human capabilities and activities (perception, judgment, etc.), in overriding mistakes that occur because of human inattentiveness, and in minimizing the damage caused by such mistakes.
It is now possible to use IT to build systems in which people, roads and vehicles are components of a unified whole. Such systems, known as Intelligent Transportation Systems (ITS), will be increasingly deployed because they make possible the following kinds of advances: [1] improved driving safety through information that compensates for delayed hazard recognition by drivers; [2] improved vehicle safety through collision avoidance technologies; [3] increasingly advanced traffic control technologies; and [4] expedited rescue and emergency medical activities.
(2) Measures to be implemented
-
{1} Improving the road traffic environment
The policies executed to date, which have dealt mainly with automobiles, have brought about a certain amount of success in improving traffic safety. Hereafter, these measures will have to be supplemented by policies that deal with the changing social situation, principally those related to an aging population and declining birthrates. To build a transportation society in which children are protected from accidents and in which the elderly can step out of their homes safely and with peace of mind, the nation will have to adopt stronger “people first” measures, which focus primarily on improving the road traffic environment by providing safe and secure walking spaces. Greater efforts will thus be made to improve sidewalks along school routes, residential roads, and major thoroughfares in urban districts.
-
{2} Dissemination and reinforcement of traffic safety messages
Encouraging a change of consciousness so that all citizens begin to view traffic safety as a personal responsibility will be an important issue. Toward that end, the nation will carry out step-by-step and systematic programs of education for all members of the public, from young children to adults. In addition, it will aim to foster a greater awareness of the importance of traffic safety among the elderly themselves. The methodology of these programs will be heavily oriented toward participation, experience and practice. In these programs, coordinators will encourage community participation while working closely with other coordinators.
-
{3} Ensuring safe driving practices
Much more can be done to enhance driver education, including in the area of education for elderly drivers. In addition to further efforts in this area, measures will be adopted to provide more comprehensive information about road traffic through the effective utilization of IT.
-
{4} Ensuring greater vehicle safety
While taking steps to further the development and maturation of measures aimed at reducing injuries, the nation will increasingly pursue measures that focus on utilizing advanced technologies in the area of preventative safety, where the point is to help drivers avoid accidents in the first place.
-
{5} Maintaining order on the roads
By carefully analyzing the circumstances surrounding traffic accidents, a clearer understanding can be gained of the particularly egregious violations that lead directly to deadly and other serious traffic accidents. Based on this analysis, the nation will adopt measures to enforce and crackdown on the most malicious, dangerous, and annoying of these violations.
-
{6} Improving rescue and emergency services systems
While taking steps to ensure continued close collaboration and cooperation among emergency service agencies, the government will adopt measures aimed at improving the ability of local agencies to deliver rescue and emergency services and emergency medical care. One special area of attention will be expanding the number of people capable of providing first aid at the scene.
-
{7} Promoting programs to support accident victims, beginning with the establishment of greater fairness in compensation for damages
In accordance with the Basic Act on Crime Victims, policies to support accident victims will be comprehensively and systematically promoted.
-
{8} Improving capabilities in research and development and investigation and analysis
In addition to supporting further research and development on the three elements of traffic safety, namely people, roads and vehicles, the nation will adopt measures to support programs of comprehensive investigation and analysis.
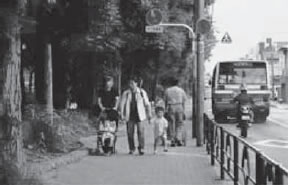
<A Secure Society: Let's Take a Walk>
Safe and secure walking spaces resulting from sidewalk improvement programs provide an inviting atmosphere for walks
2 Overview of Current Policies on Road Traffic Safety
2-1 Improvement of road traffic environment
- Implementation of projects to improve road safety facilities
- In FY2005 the nation vigorously pursued the following projects for improving the road traffic safety infrastructure, in line with the “Priority Plan for Social Infrastructure Development.”
-
-
(1) In 2003, certain intersections and road sections with high rates of death or injury-inducing accidents, or with high incidences of such accidents, were designated as “black spots.” National and local agencies launched a project to reduce the number of accidents at these sites by roughly 30% by FY2007. Prefectural public safety commissions and road management agencies collaborated in a unified effort to implement accident-prevention measures at these sites. Moreover, in FY2005, project teams adopted a new “priority indication method,”2 by which they selected other previously undesignated dangerous sections of roads for priority accident-prevention measures.
To carry out effective and efficient traffic safety measures, traffic safety agencies took steps to improve their ability to analyze accidents and to accumulate and utilize this know-how. In addition, they used two manuals, the “Road Safety Manual for Hazardous Spots”3 and the “Compilation of Accident Prevention Measures,”4 to propose and carry out measures for black spots and to pursue scientifically sound accident-prevention measures. They also built a data base for use in formulating accident measures. Finally, experts were also brought in to evaluate the measures that were adopted both prior to and following execution.
-
(2) In the nation's Safe Pedestrian Area project, project teams, with the cooperation of prefectural public safety commissions and road management agencies, continued to implement areawide and comprehensive accident prevention measures. These were executed in residential and commercial districts that had been designated as target areas in 2003 because of their high incidence of accidents resulting in death or injury. The goal of the program was to reduce casualty-inflicting accidents in the designated areas by approximately 20% overall and approximately 30% for pedestrians and bicycle riders by FY2007.
Residential roads outside the Safe Pedestrian Areas were also an area of concern. Utilizing the “Road Safety Manual for Residential Roads,”5 project teams collaborated with prefectural public safety commissions and road management agencies to achieve a number of goals, including limiting the speeds at which automobiles traveled through in these areas, providing drivers with signs that alerted them to road characteristics and intersections, and clearly demarcating sections of roads to be used by traffic and by pedestrians. In this way, the project teams endeavored to create road spaces that would be shared safely and securely by pedestrians and automobiles alike.
-
(3) Another issue was the need to provide a safe and comfortable transit environment for pedestrians and bicycle riders. In dangerous sections of roads where pedestrians were frequently injured in accidents, the nation continued to make improvements via road reconstruction projects and to focus on sidewalk and bike path construction.
In these projects, wide sidewalks assuring comfortable transit for users continued to be developed. Where space along existing roads did not permit the building of sidewalks, the nation substituted exclusive pedestrian roads or bicycle and pedestrian paths which ran parallel to existing roads.
In order to help seniors and disabled people lead independent, socially active lives, projects were also implemented to develop broad, level sidewalks and to install barrier-free signals in areas around train stations and other public facilities. The nation also endeavored to eliminate utility poles, convert traffic signals to LED lighting, and develop improved road signs and markings to make them more visible to elderly motorists.
-
| 2 | “Priority indication method” This method provides a way of executing projects in an effective and efficient way by identifying locations where measures should be carried out on a priority basis. Priority is determined by expressing need in terms of objective data and lining projects up according to the degree of urgency of the problems that have been identified. |
|---|---|
| 3 | “Road Safety Manual for Hazardous Spots” This manual is a systematic compilation of procedures, points of consideration, and other matters related to the entire process of traffic safety measure implementation, from proposal to assessment. It is based on the results of accident countermeasures previously implemented under the Black Spot Emergency Measures Program and other projects. |
| 4 | “Compilation of Accident Prevention Measures” For this publication, experts analyzed the causes of accidents occurring at 557 black spots and the measures adopted in response to these accidents, looking at each accident in terms of road characteristics and type of accident. |
| 5 | “Road Safety Manual for Residential Roads” The aim of this manual is to illustrate ways of effectively implementing accident prevention measures on residential roads. It presents in a systematic way procedures, methods of improving road traffic environments, etc. |
| 6 | Field tests: actual outdoor tests. |
- Development of Intelligent Transport Systems
- In 1996, the nation formulated a major plan on intelligent transport systems called the Comprehensive ITS Initiative. Its aim was to use advanced information technology to build systems that brought people, roads and vehicles under one integrated system, thereby enhancing road safety and transportation efficiency. Based on this plan, the nation adopted measures to promote research and development, field tests6, and infrastructure development.
-
(1) A key component of ongoing work on ITS has been the Universal Traffic Management Systems (UTMS), whose aim is to ensure traffic safety and comfort through a network of advanced traffic control centers. Using near-infrared beacons, the system envisages the creation of control centers that will be able to establish two-way communications with individual vehicles on the road, thus giving the centers the ability to actively and comprehensively manage traffic flows and volumes. Via this means, the UTMS is aiming to provide advanced traffic information, to manage vehicular operations, and to give priority to public vehicles, as well as to reduce traffic pollution, support safe driving, and ensure pedestrian safety. Based on the UTMS concept, the nation took steps to improve its traffic systems and to install facilities for near-infrared beacons, which are the key infrastructural component of the UTMS system.
-
(2) Work also continued on cruise-assist systems, which aim to support safe and secure highway cruising and to reduce traffic accidents. These are systems in which information on hazards is communicated to drivers instantaneously using telecommunications systems which connect the car with the highway. With this ability to communicate instantaneously, drivers can be provided with assistance that had previously been considered impossible, including information that compensates for delayed hazard recognition, warnings against incorrect judgments, and support for the maneuvering task. Utilizing ETC technology, which the International Telecommunications Union (ITU) established as the international standard for these systems, the nation conducted research and development on a tripartite set of technologies: next-generation highways based on ITS specifications (Smartways); advanced telecommunications that link on-car and highway systems (Smart Gateways); and cars that cruise at high speeds (Smart Cars). During the year, the nation also promoted measures to expedite the adoption and dissemination of these technologies. These included demonstration tests that investigated the appropriateness of performance requirements and the public's acceptance of services.
-
Focus
Sidewalk Development:Providing People-First Walking Spaces that Offer Safety and Bestow Peace of Mind
In FY2005, the number of road traffic fatalities declined below 7,000 for the first time in 49 years (since 1956). Still, the percentage of pedestrian deaths to the total number of traffic fatalities was high in comparison to Europe and the United States. Hence, taking steps to assure the safety of those who are in a weak position compared to those in automobiles will remain an important traffic safety issue hereafter.
In this section, we review the current situation of pedestrian accidents in Japan and describe steps that are being taken to improve sidewalks and other facilities. The report then goes on to describe the policies that the nation will promote hereafter to develop walking spaces that will offer greater safety to pedestrians.
1 Traffic accidents involving pedestrians and status of sidewalk development projects
(1) The current state of pedestrian accidents
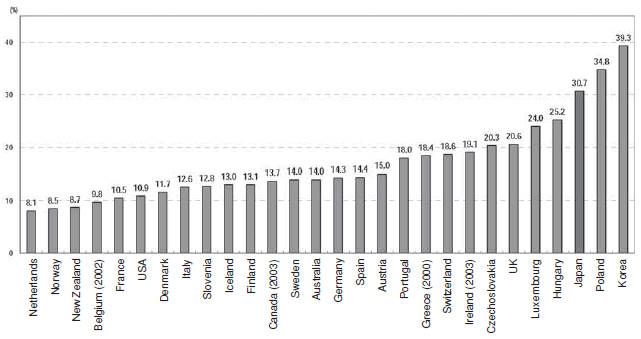
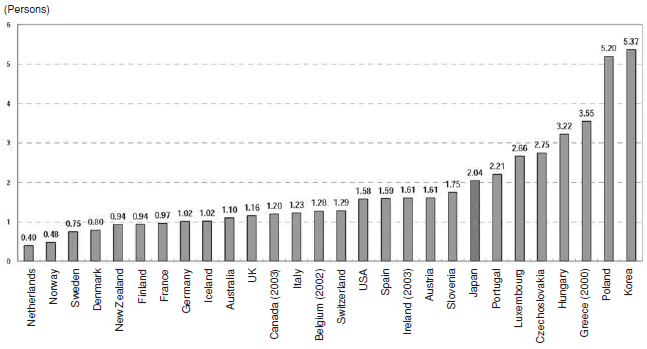
{1} Compared to Europe and the United States, pedestrian fatalities in Japan make up a high percentage of total traffic deaths. Moreover, the number of pedestrian deaths is high on a per capita basis.
Percentage of Pedestrian Fatalities to Total Traffic Fatalities
Notes: |
1. | Source: IRTAD and OECD data |
|---|---|---|
| 2. | Except when otherwise indicated in parenthesis, the data is for 2004. | |
| 3. | The data is based on all deaths occurring within 30 days of an accident |
Pedestrian Fatalities per 100,000 Persons
Notes: |
1. | Source: IRTAD and OECD data |
|---|---|---|
| 2. | Except when otherwise indicated in parenthesis, the data is for 2004. | |
| 3. | The data is based on all deaths occurring within 30 days of an accident |
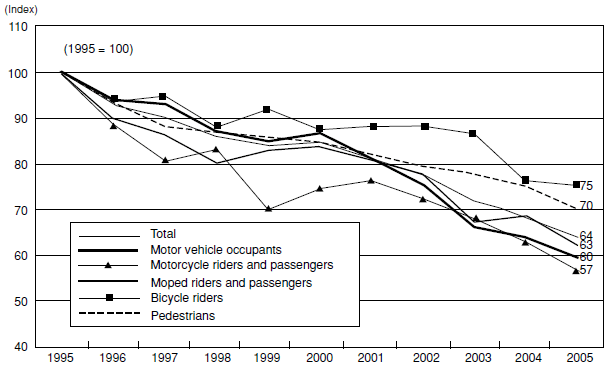
{2} The trends of recent years show that the rate of decline in fatalities is lower for pedestrians than for occupants of automobiles.
Trend in Traffic Fatalities, by Mode of Transportation
Notes: |
Source: National Police Agency The “other” category has been omitted from the above table. |
|---|
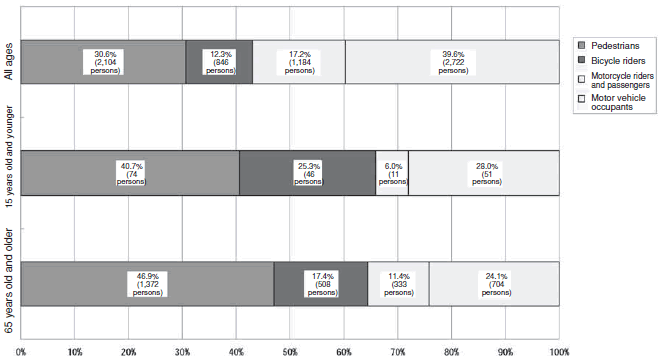
{3} The data by age and mode of transportation show that the proportions of pedestrian fatalities are high especially among children and elderly persons.
Breakdown of Fatalities by Age and Mode of Transportation (2005)
Notes: |
Source: National Police Agency The “other” category has been omitted from the above table. |
|---|
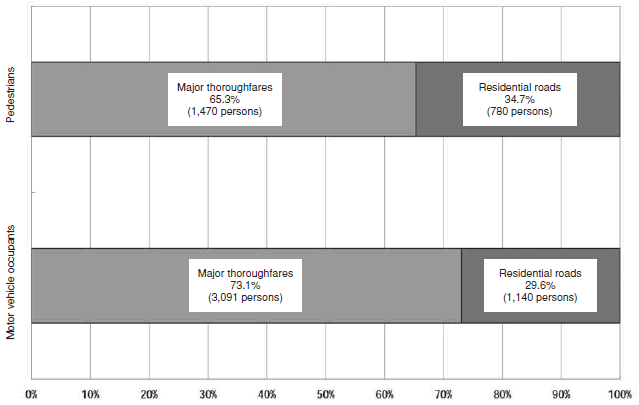
{4} The data on fatalities by mode of transportation and by type of road indicates that pedestrian fatalities along major thoroughfares (roads for exclusive use by automobiles; national roads, excluding expressways; prefectural roads) are higher than those along residential roads (municipal roads etc.). However, when looking at the ratios of deaths on residential roads in terms of mode of transportation, the ratio in pedestrian fatalities is higher than that in fatalities to occupants of automobiles (“automobiles” referring here also to motorcycles and mopeds).
Breakdown of Fatalities by Mode of Transportation and by Type of Road (2004)
Notes: |
Source: Ministry of Land, Infrastructure and Transport |
|---|
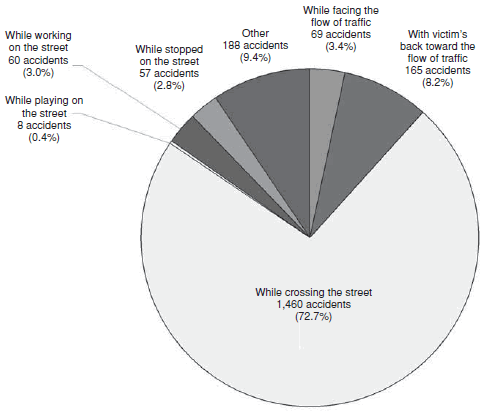
{5} Accidents where cars hit pedestrians frequently occur when pedestrians are crossing the street.
Number of Fatal Accidents by Type of Accident (pedestrians hit by automobiles) (2005)
Notes: |
Source: National Police Agency |
|---|
(2) Improvements for sidewalks etc
{1} Roads with newly constructed sidewalks etc.
Over the past 10 years, the length of roads along which sidewalks etc. (including paths for joint use by pedestrians and bicyclists, and bike paths) have been constructed increased by 35,693 km (an increase of approximately 30%). The increase along municipal roads was 21,668 km (an increase of approximately 40%).
Development rate for sidewalks etc. along all roads
| 1994 | 2004 | From 1994 to 2004 |
|---|---|---|
| 120,093 km | 155,786 km | +35,693 km |
Notes: |
Source: Ministry of Land, Infrastructure and Transport As of April 1, 2004 |
|---|
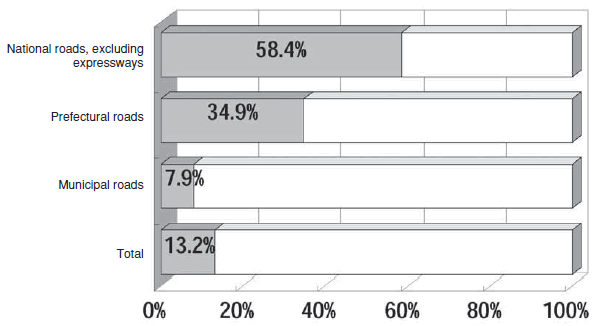
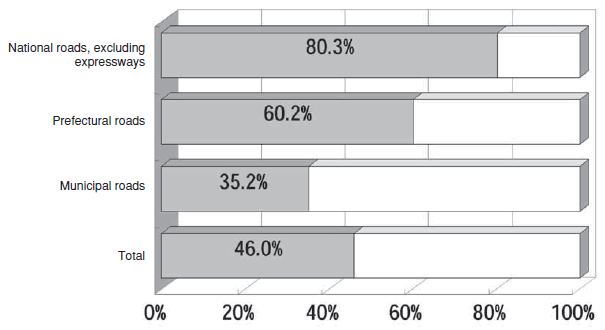
{2} Along school routes, the nation has been seeking to ensure safe commutes by children to and from schools by giving priority to sidewalk improvements along such routes through increasing subsidy rates7. Consequently the rate of development of sidewalks etc. along such roads is higher than along other roads.
7 Ordinarily, the subsidy rate is 5/10. For school routes along municipal roads, the rate is 5.5/10.
Development rate for sidewalks etc. along all roads
Notes: |
Source: Ministry of Land, Infrastructure and Transport As of April 1 of each year. |
|---|
Development rates for sidewalks etc. along heavily used school routes
Notes: |
Source: Ministry of Land, Infrastructure and Transport
|
|---|
